- The S&P 500 closed at 7,580.07, down 0.57% on the week, under Friday's open gap from 7,637 to 7,691, with the Sep 16 low at 7,508 as the next shelf below.
- The Nasdaq 100 lagged with a 1.98% weekly drop to 28,384.85, below its 20 and 50-day averages and about 1.6% above its 200-day at 27,927.
- Intel's 28.6% Friday drop and Alphabet's 12.6% weekly slide put both on the board; the pivot that matters most is the S&P's 7,637, the bottom of Friday's gap.
Key numbers
Levels to watch
- 7,844.52RESISTANCEOct 6 high, the top of the chart
- 7,700RESISTANCE50-day average near 7,697, top of Friday's gap at 7,691 and the heaviest strike nearby
- 7,637.48PIVOTFriday's high and the bottom edge of the open gap
- 7,507.77SUPPORTSep 16 low, just under Friday's 7,527.56 low and the big 7,500 put strike
- 7,309.76SUPPORT200-day average
- 29,796RESISTANCE50-day average, near the Oct 28 close of 29,813
- 29,257.05RESISTANCETop of Friday's gap, Thursday's low
- 28,713.45PIVOTFriday's high and the bottom edge of the open gap
- 28,093.25SUPPORTFriday's low, above the 28,000 put strike
- 27,927.30SUPPORT200-day average
- 322.65RESISTANCETop of Thursday's gap, Wednesday's low
- 300.00RESISTANCERound number and the heaviest strike near the price
- 288.33PIVOTThursday's high and the bottom of the post-earnings gap
- 276.92SUPPORTFriday's low, by the heavy 280 put strike
- 272.11SUPPORTMar 30 low, the lowest level of 2026
- 90.84RESISTANCETop of Friday's gap, Thursday's low, above the 200-day average at 86.86
- 80.00RESISTANCERound number and the largest open-interest strike
- 70.00PIVOTRound number and heavy strike, just above Friday's 68.77 high
- 63.20SUPPORTFriday's low
- 60.75SUPPORTApr 10 low, the floor of the April base
The week's charts turned on one day. The S&P 500 spent Monday through Thursday inside a range above its 50-day average, then fell 1.82% on Friday and closed at 7,580.07, leaving an open gap between 7,637 and 7,691 above it. The Nasdaq 100 dropped 3.46% on Friday and ended the week 1.98% lower, about 9.5% below its Oct 6 high.
The S&P 500
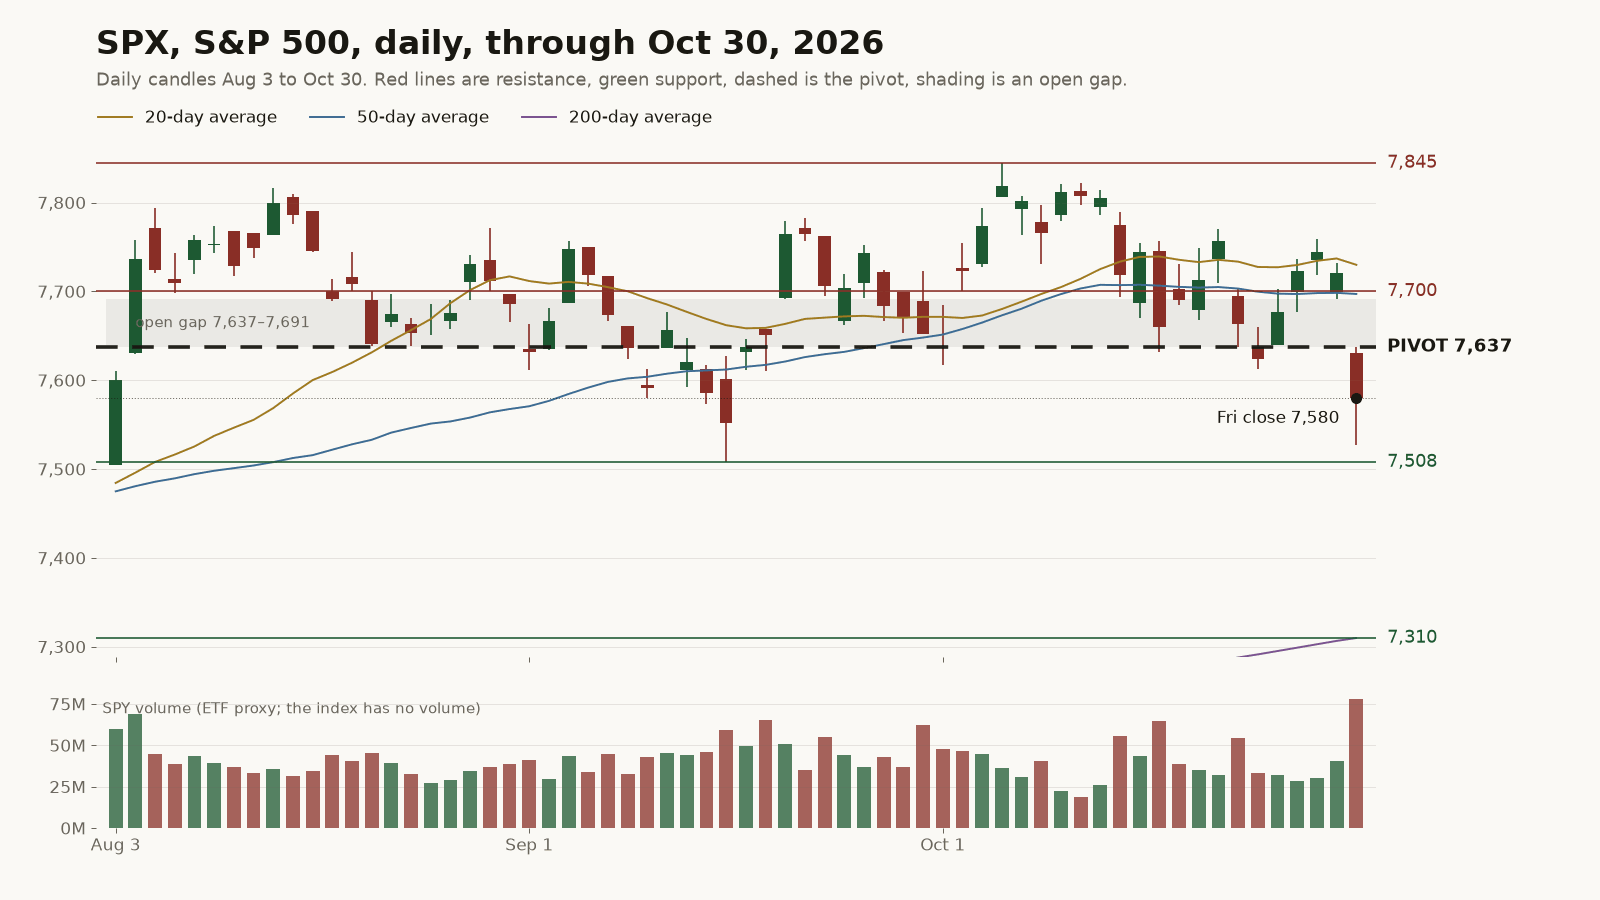
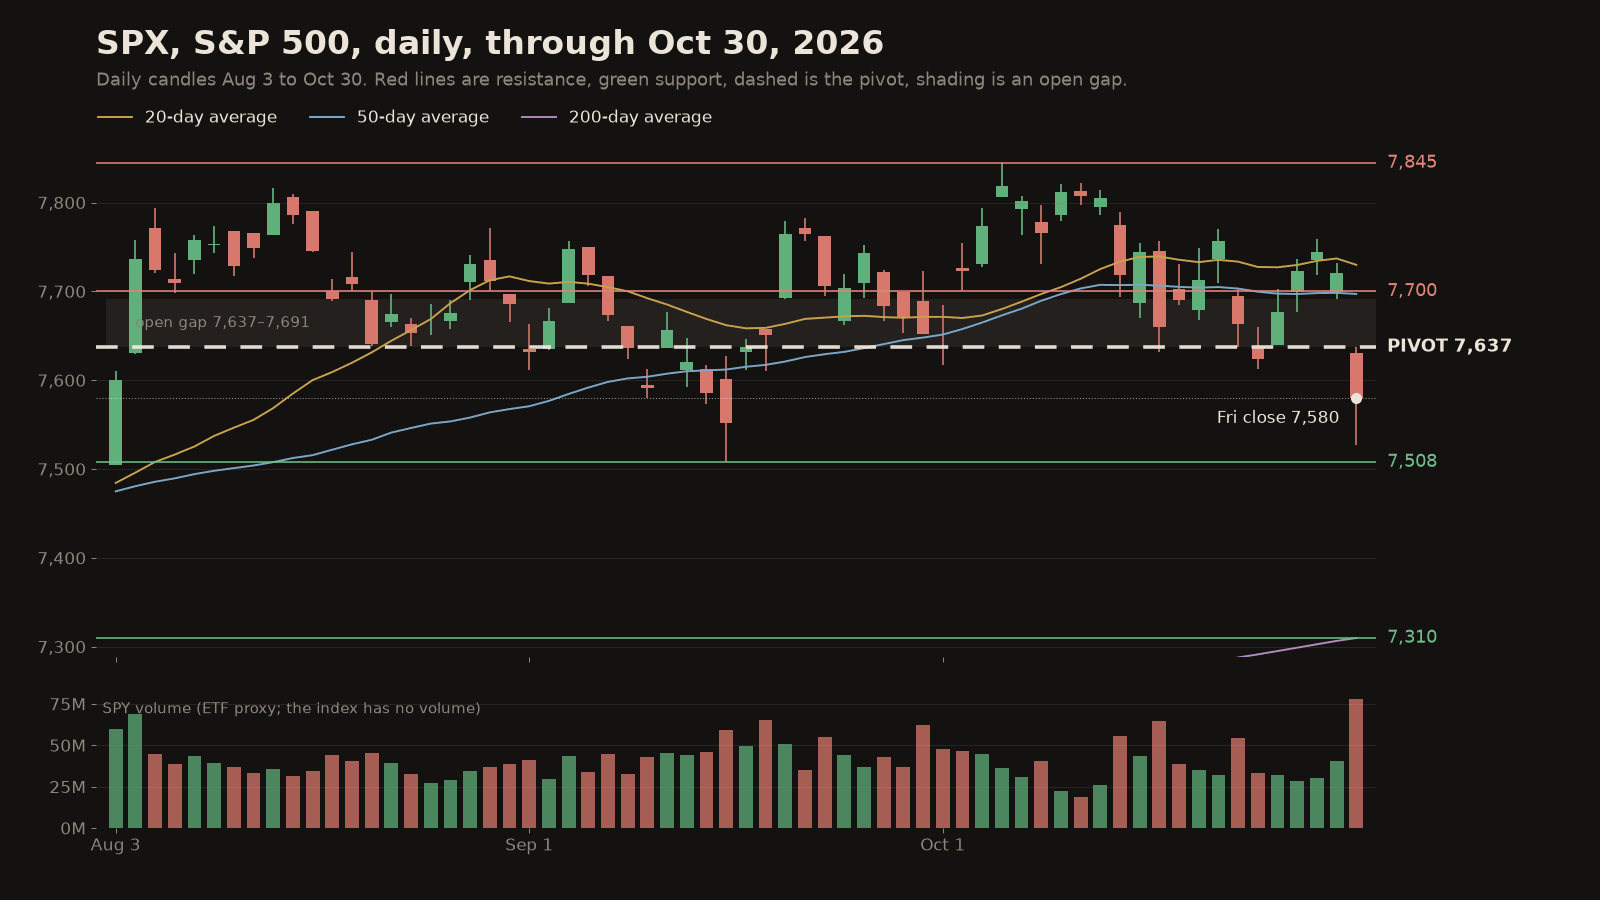
The index has been making lower highs since the Oct 6 high at 7,844.52, and Friday's close is about 3.4% below it. It sits under both the 20-day average at 7,730 and the 50-day at 7,697, but still about 3.7% above the 200-day at 7,310. The pivot is 7,637.48, Friday's high and the bottom of the gap. The 7,700 area above it lines up the top of the gap, the 50-day average and the most crowded strike near the price. Below, Friday's 7,527.56 low sits just over the Sep 16 low at 7,507.77, the last time buyers stepped in on this chart, with heavy put open interest at 7,500.
The Nasdaq 100
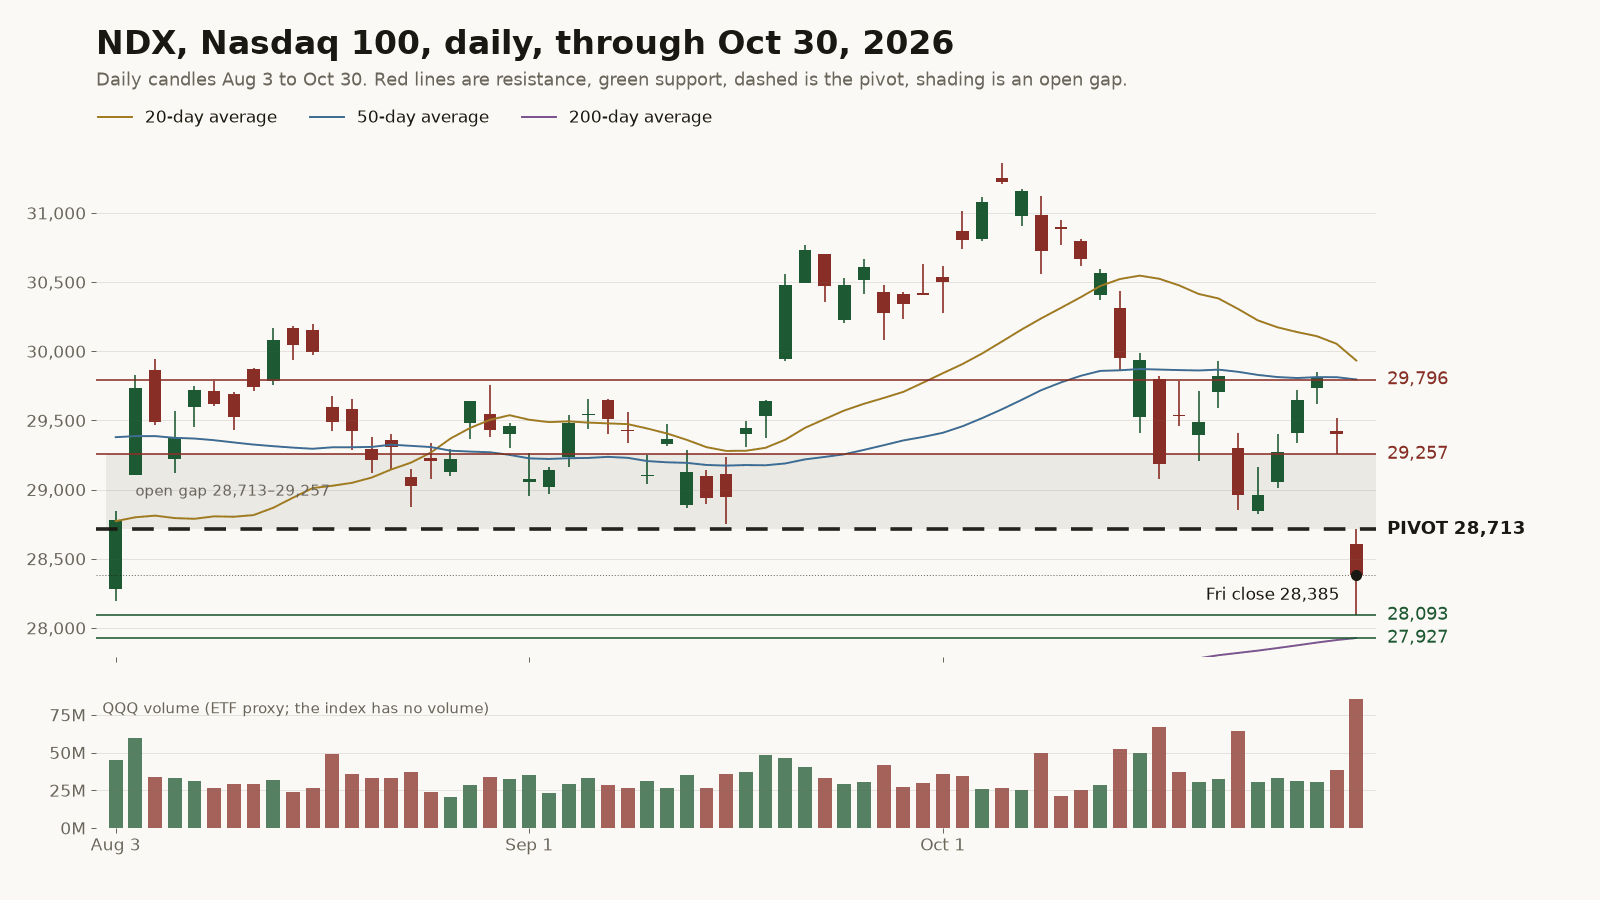
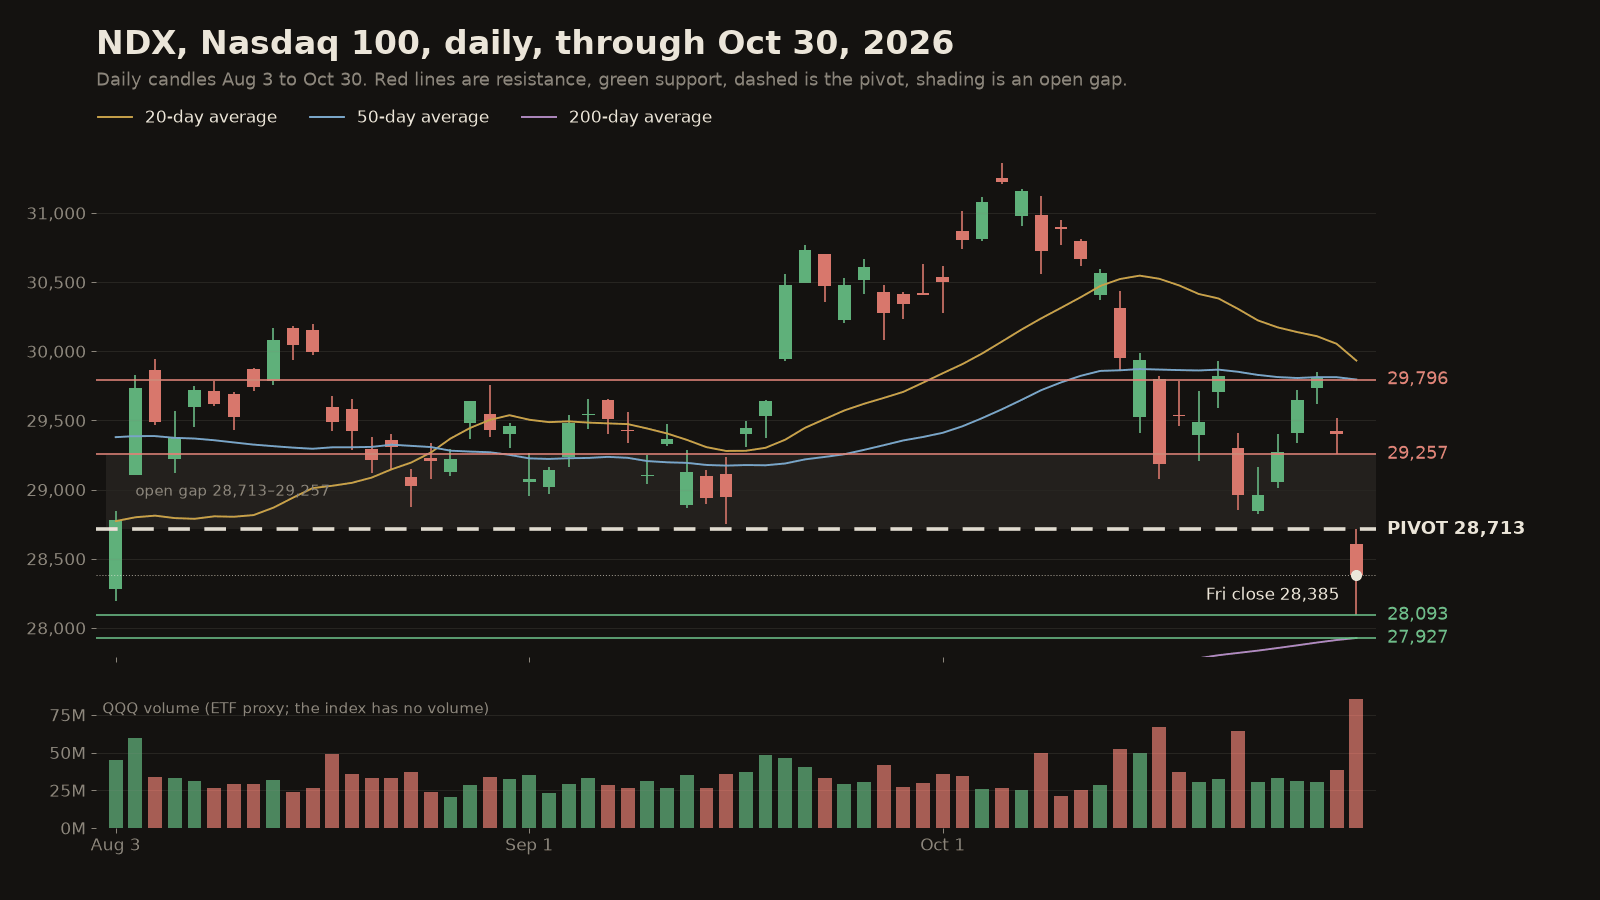
Tech led the way down. The Nasdaq 100 lost 1.98% on the week against 0.57% for the S&P, and Friday's 3.46% drop left a 544-point gap from 28,713 to 29,257. The index is below its 20-day average at 29,933 and its 50-day at 29,796, and about 1.6% above its 200-day at 27,927, the closest any of the three averages has been to price on this chart. The pivot is 28,713.45, the bottom of the gap. Friday's low at 28,093.25 is the nearest support, with the 200-day just under it.
Alphabet after its worst day on record
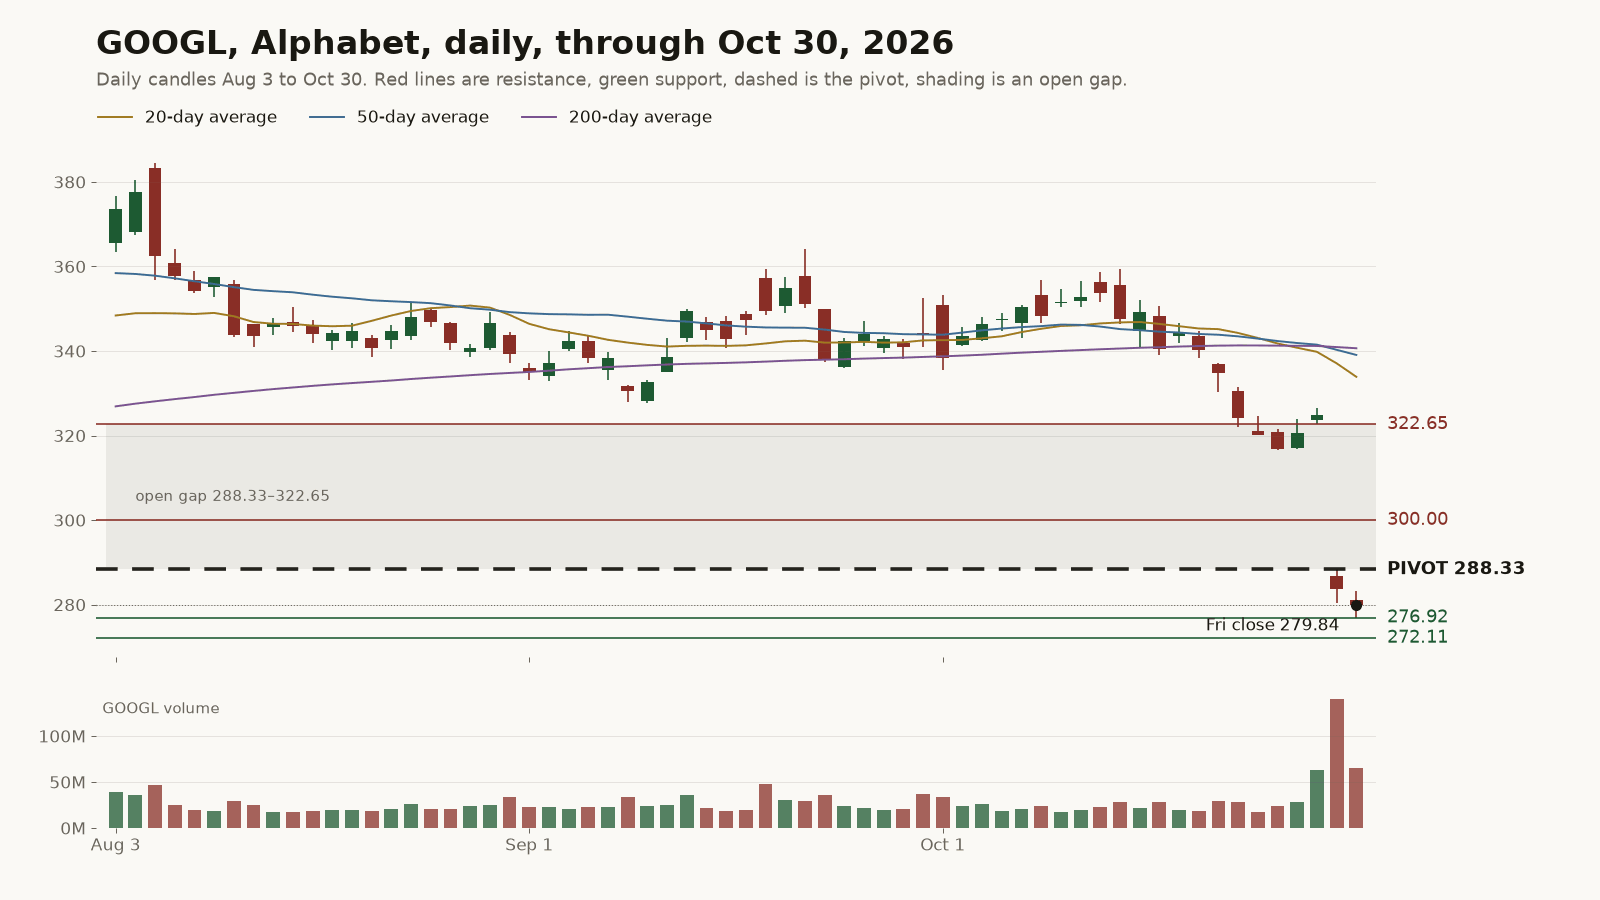
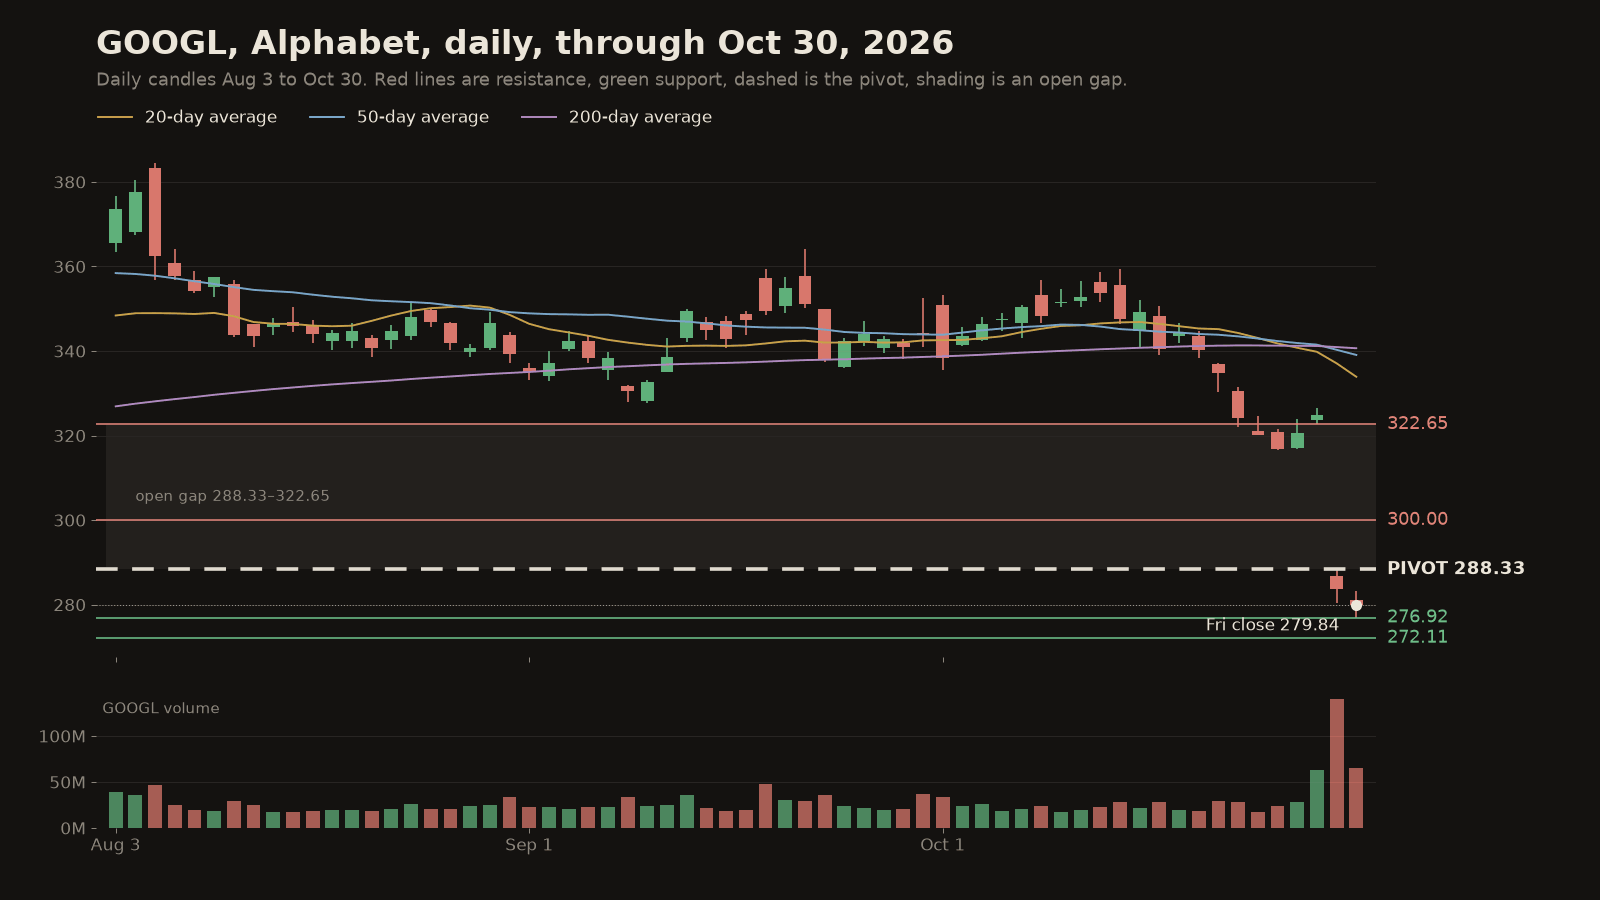
Alphabet made the board after falling 12.64% on Thursday following its quarterly report, a drop wires called its worst day on record, and it ended the week down 12.61% at 279.84. The report left a 34-point gap from 288.33 to 322.65 that Friday never touched. All three averages now sit between 334 and 341, above the gap. The pivot is 288.33, the bottom of that gap. Below, Friday's 276.92 low and the March 30 low at 272.11, the lowest level of 2026, are the levels with history.
Intel after its biggest drop in decades
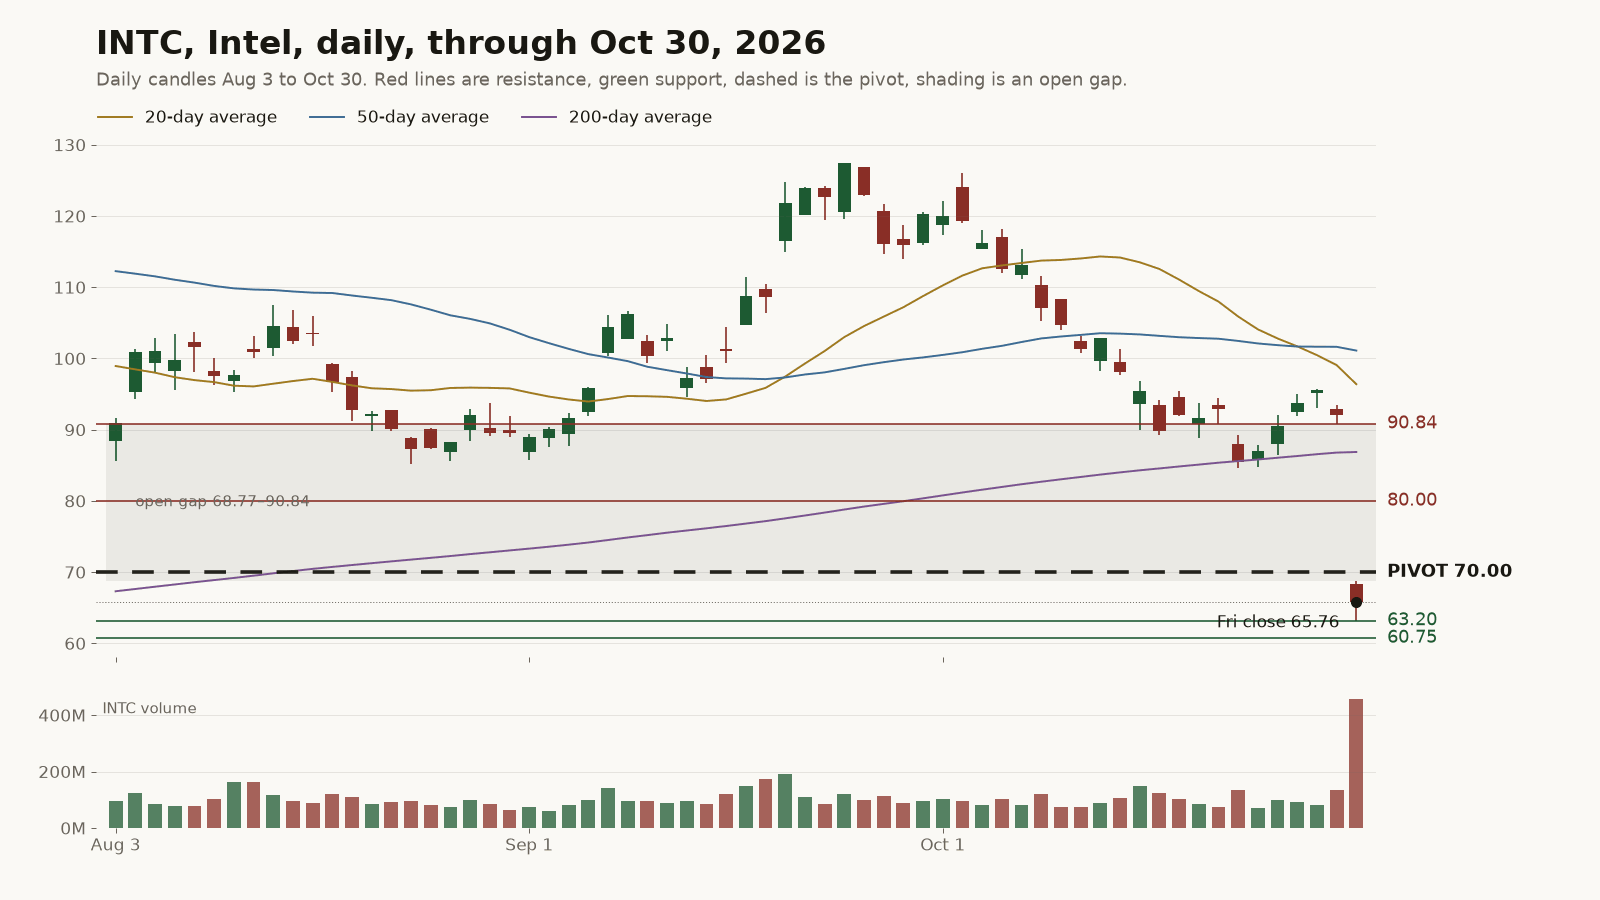
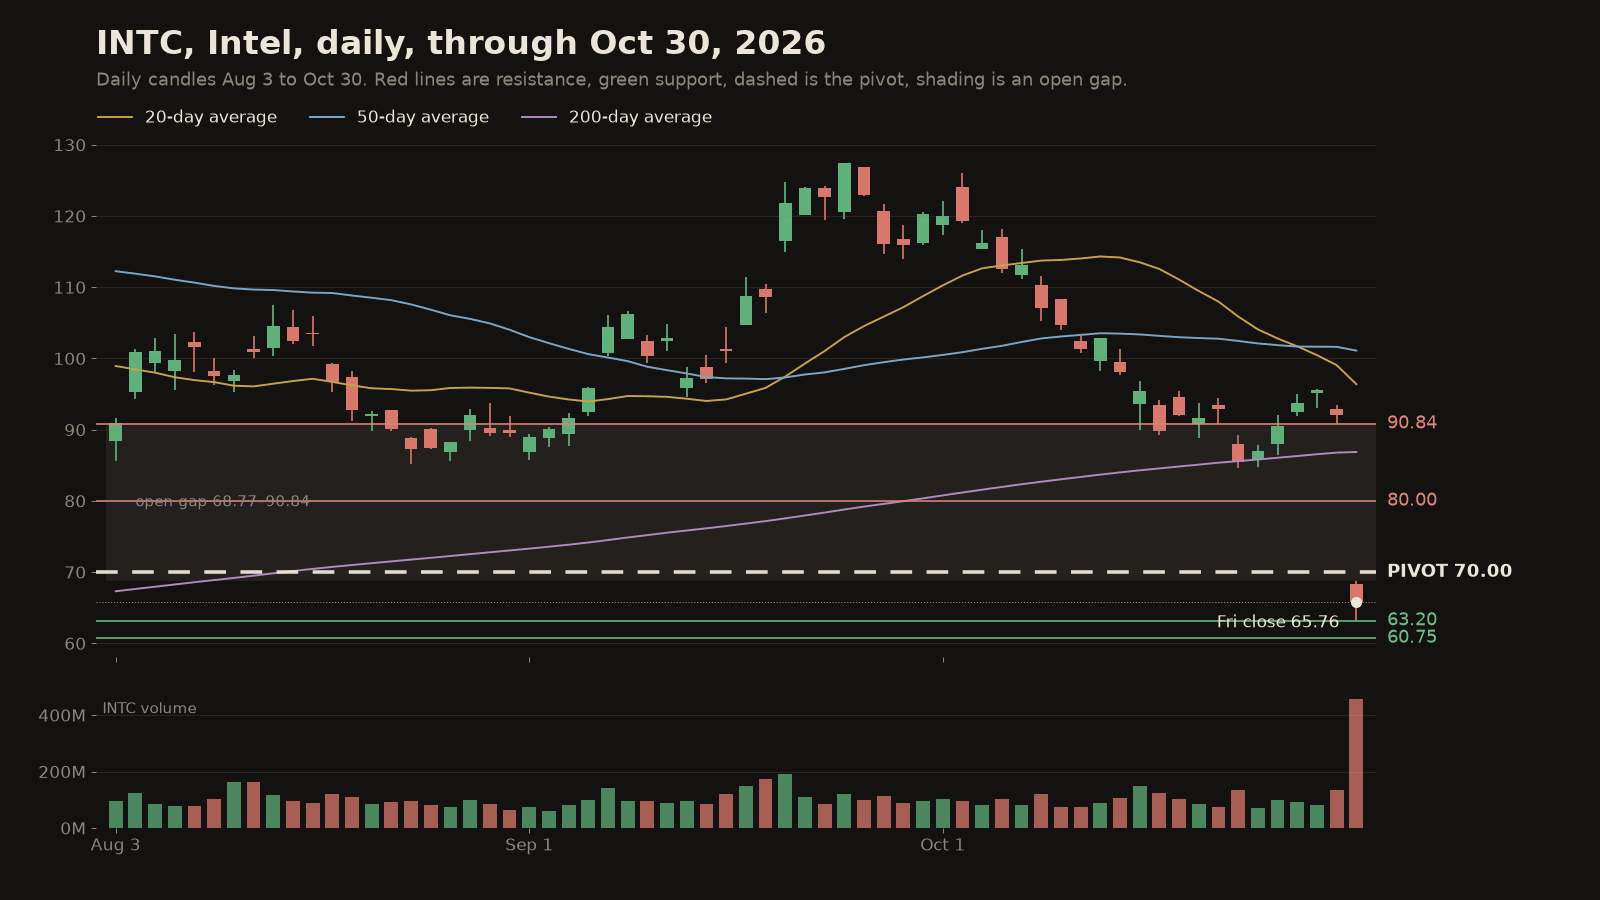
Intel fell 28.58% on Friday after weaker-than-expected guidance, its worst day since the 1970s according to wires, and finished the week down 24.38% at 65.76. It gapped straight through its 200-day average at 86.86 and left a gap from 68.77 to 90.84. The pivot is 70, a round number with heavy open interest just above Friday's 68.77 high. Friday's low at 63.20 is the first support, then the April lows near 60.75, where the stock last based before its spring run.
Pivot moments next week
Monday brings the manufacturing PMI at 9:45 AM ET (prior 55.9) and ISM manufacturing at 10:00 AM ET (prior 54.5), the first test of the S&P's 7,637 pivot, and Apple and Palantir report after the close with implied moves of about 3.7% and 11.3%, a test of the Nasdaq's 28,713. The chip read-through for Intel comes from AMD after Tuesday's close (implied move about 7.6%) and Arm and Qualcomm after Wednesday's close (about 10.5% and 8.4%). Wednesday also has ADP at 8:15 AM ET and ISM services at 10:00 AM ET (prior 54.9). Friday's October jobs report at 8:30 AM ET (prior unemployment rate 4.2%) is the week's last test of whatever line holds, the S&P's 7,508 below or the gap above.
How to read these levels
These levels mark where the market has reacted before and may again. They are not predictions or trade signals. A daily close through a level says more than an intraday poke, and an open gap tends to stay a reference point until price trades back through it.
- CoolingThe AI spending boomThe two names on the board both fell on AI spending worries, and the Nasdaq 100's 1.98% weekly drop left it about 1.6% above its 200-day average.
SOURCES ›
- Economic calendar, pulled 10:06 AM ET 2026-10-31: Mon 11/2 US manufacturing PMI (prior 55.9), ISM manufacturing PMI (prior 54.5); Tue 11/3 JOLTS, factory orders; Wed 11/4 ADP employment (prior 90,000), ISM services PMI (prior 54.9); Thu 11/5 jobless claims; Fri 11/6 employment report, unemployment rate (prior 4.2%), U. Michigan sentiment (prior 46.3). No forecasts posted. The calendar feed lists times one hour early after the Nov 1 clock change; standard ET release times used (PMI 9:45 AM, ISM 10:00 AM, ADP 8:15 AM, jobs 8:30 AM).
- Earnings calendar, pulled 10:06 AM ET 2026-10-31: AAPL (expected move about 3.7%) and PLTR (about 11.3%) after the close Mon 11/2; AMD after the close Tue 11/3 (about 7.6%); ARM (about 10.5%) and QCOM (about 8.4%) after the close Wed 11/4
- Earnings history: GOOGL reported 2026-10-28 after the close (1-day move −12.64%); INTC reported 2026-10-29 after the close (1-day move −28.58%)
- Quotes, daily bars: SPX and NDX index values and SPY, QQQ, GOOGL, INTC, 2025-06-02 to 2026-10-30 (4:00 PM ET closes); chart window Aug 3 to Oct 30; 20, 50 and 200-day simple averages from daily closes
- Week change: Oct 30 close vs Oct 23 close (SPX 7,623.68, NDX 28,957.53, GOOGL 320.21, INTC 86.96)
- Volume panels for SPX and NDX use SPY and QQQ share volume (index bars carry no volume)
- Options open interest by strike, session 2026-10-30: SPX 7,700 (167,292 calls, 182,421 puts), 7,500 (184,332 puts); NDX 28,000 (3,637 puts); GOOGL 300 (89,401 calls, 100,280 puts), 280 (102,557 puts); INTC 80 (129,227 calls, 280,760 puts), 70 (157,845 calls, 239,586 puts)
- Closing mood for Oct 30 from data/market/day-moods.json
- @CNBC — “Alphabet tanks nearly 13% for worst day ever, losing $500 billion in value”
- @WSJ — “A $500 billion wipeout in market value just made it the ugliest day ever for Alphabet shares”
- @Reuters — “Wall Street ends lower as Alphabet revenue miss revives AI capex jitters”
- @CNBC — “Intel shares plummeted 29% on Friday, their worst day since the 1970s, after the chipmaker issued weaker-than-expected guidance”
- @Reuters — “Amazon burns cash, Intel flags weak PC demand as AI boom's costs ripple across markets”
- @YahooFinance — “Intel just had its worst day since 1974 after warning that the PC slump will last into next year.”
Get tomorrow's brief before the open.
Weekdays at 8:30 ET. Free. Unsubscribe anytime. Privacy