- A gap is the empty space on a chart between one day's close and the next day's open, and a gap fill is price trading back across that space to the prior close.
- Amazon closed at $243.79 on Oct 29, opened at $232.54 after its report, climbed to $241.55 by 11:25 AM ET the same day and traded above $243.79 in the first 5 minutes of Nov 2. AMD opened 10.2% lower the same Friday and closed Nov 2 at $466.84, about 17.6% below the gap's top.
- Fills tend to work when the selling at the open runs out and the opening low holds, and fail when the news behind the gap keeps getting worse. The classic mistake is treating every gap as a magnet that has to close.
Key numbers
Gap fill
- On a daily chart, find a session that opened well above or below the prior day's close, and mark that close: it is the far edge of the gap and the full-fill level.
- Mark the prior day's low for a gap down (high for a gap up): reaching it is a partial fill, the first sign the gap is closing.
- Watch the first 30 minutes on a 5-minute chart and mark the opening low (high for a gap up): that is the invalidation, the line that says the gap is extending instead of filling.
- A fill is confirmed when price trades back through the prior close; a break of the opening extreme says the gap is running.
- Before anything else, ask why it gapped: a gap the news fully explains can keep going, as AMD's did.
Amazon reported after the bell on Thursday, Oct 29, and opened Friday at $232.54, about 4.6% below its $243.79 close. By 11:25 AM ET it had climbed back to $241.55, and on Monday it traded above $243.79 in the first five minutes of the session. The same Friday, AMD opened about 10.2% lower and never came close to closing its gap. This morning Apple and Palantir opened with gaps of their own, which makes this week a good one to learn the most-repeated idea in chart talk: gaps get filled. Sometimes they do. The useful part is knowing which ones.
What it is
A gap is the empty space on a chart when a stock opens well away from where it closed the day before, usually because news landed while the market was shut: an earnings report, a guidance change, a deal or a big overnight move in the futures. No shares traded at the prices in between during regular hours, so the chart shows a hole. A gap fill is price trading back across that hole to the prior close.
What the pattern says about buyers and sellers is simple. A gap down means sellers overwhelmed the overnight market. If that pressure was mostly a rush to the exits at the open, the selling runs out, buyers who think the drop went too far step in, and price drifts back toward where everyone agreed on value the day before. If the news really changed what the company is worth, there is no reason for price to go back, and the gap can become the start of a new trend.
How it works
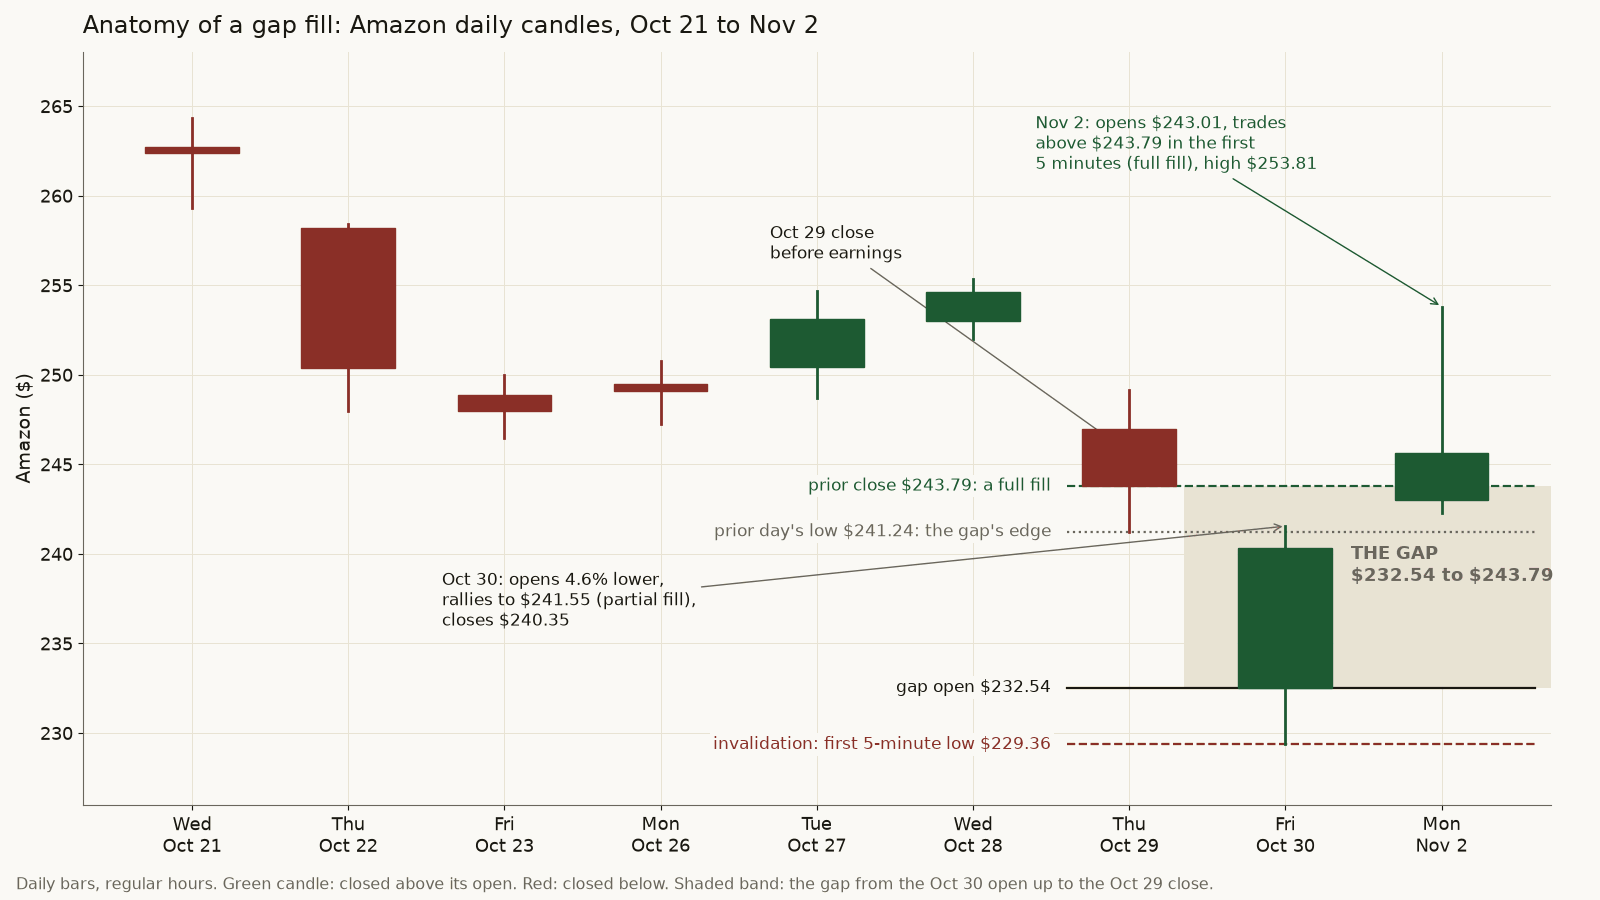
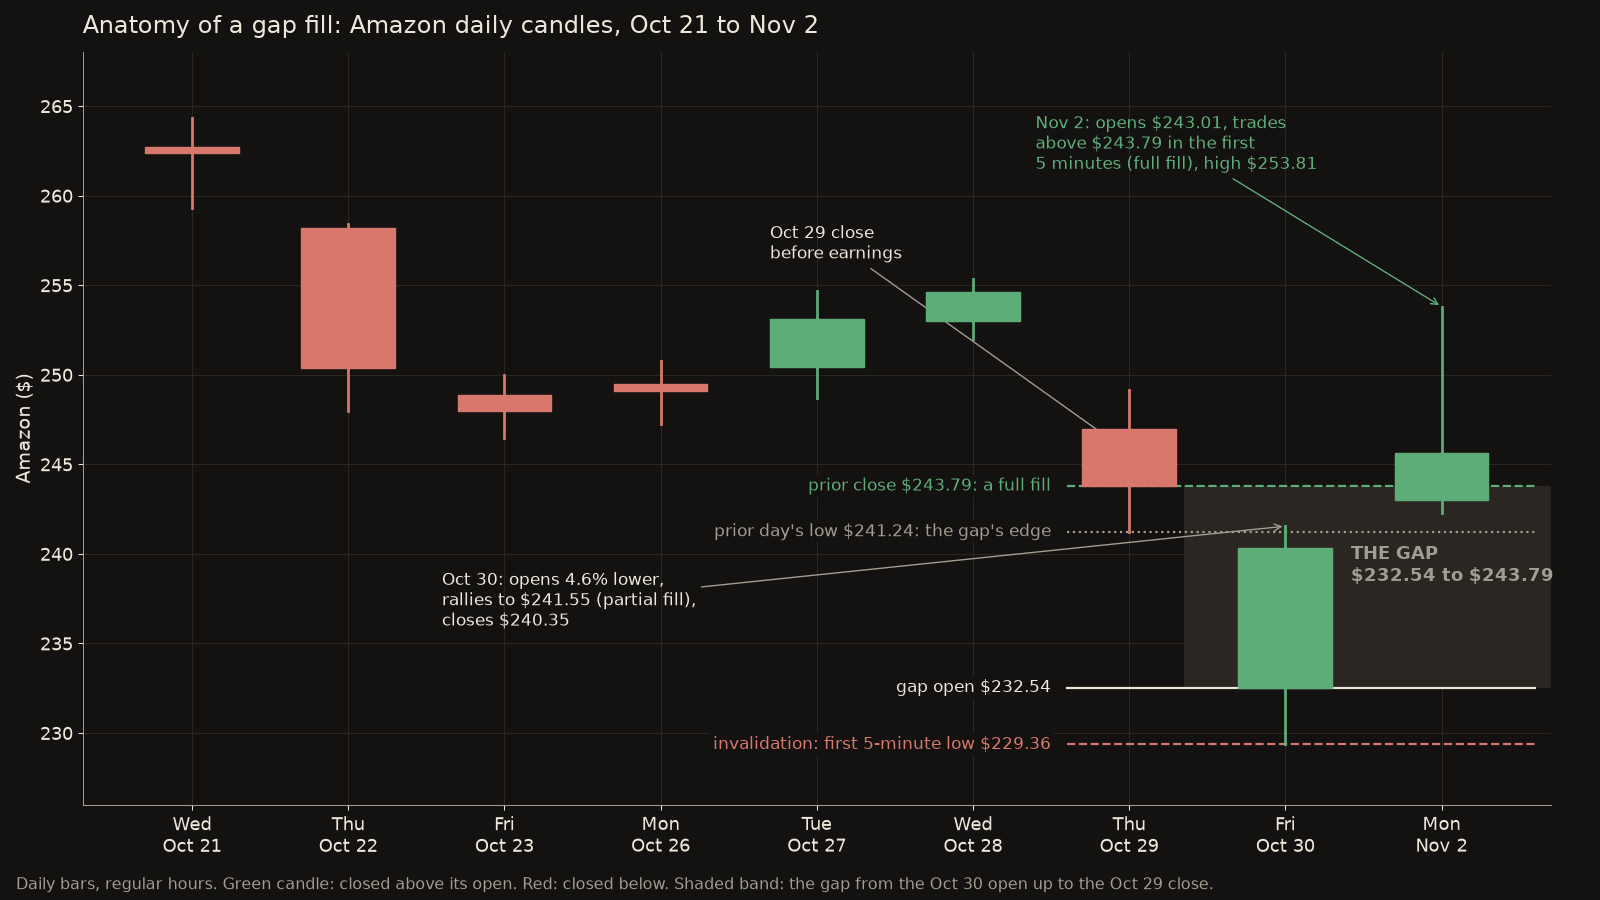
Use a daily chart to spot the gap and a 5-minute chart to watch it. For a gap down, draw three lines. The first is the prior day's close, here $243.79: trading back above it is a full fill. The second is the prior day's low, here $241.24: that is the near edge of the true gap, the price range where no shares changed hands at all, and reaching it is a partial fill. The third is the low of the opening minutes, here $229.36 in the 9:30 AM ET bar: that is the invalidation. A gap up works the same way upside down, with the prior day's high and the opening high.
What confirms a fill in progress is price holding above the opening low and making higher lows through the first hour. What invalidates it is a break of the opening low, which says the sellers who caused the gap are still in charge. Gaps can fill the same day, a few days later or never; the chart doesn't say which in advance, so the levels matter more than the forecast.
On this week's tape
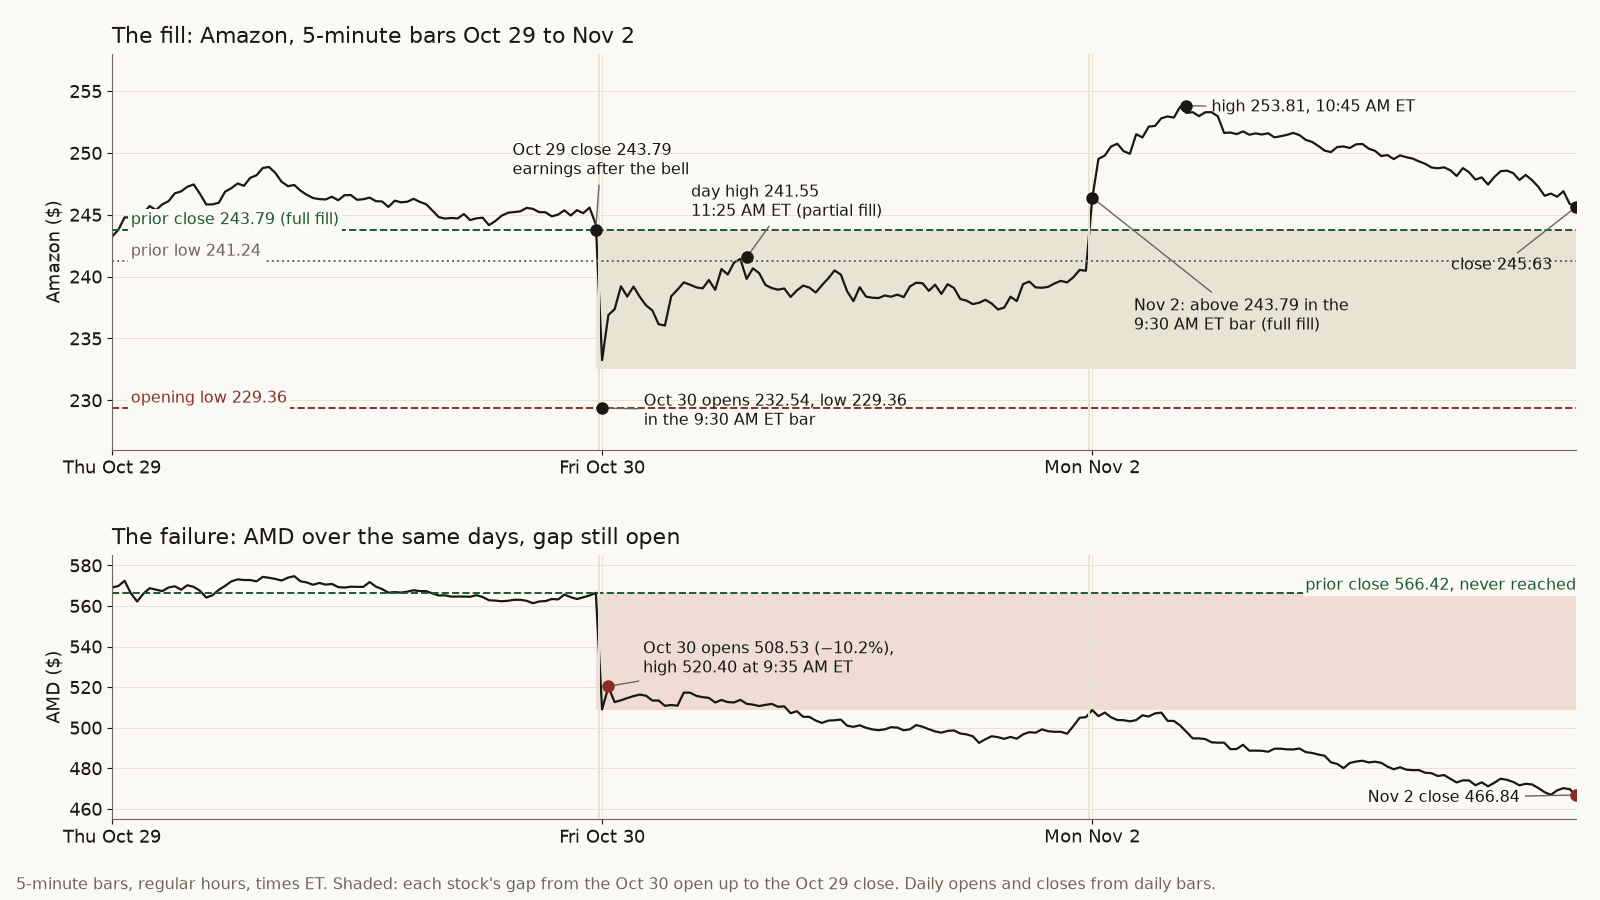
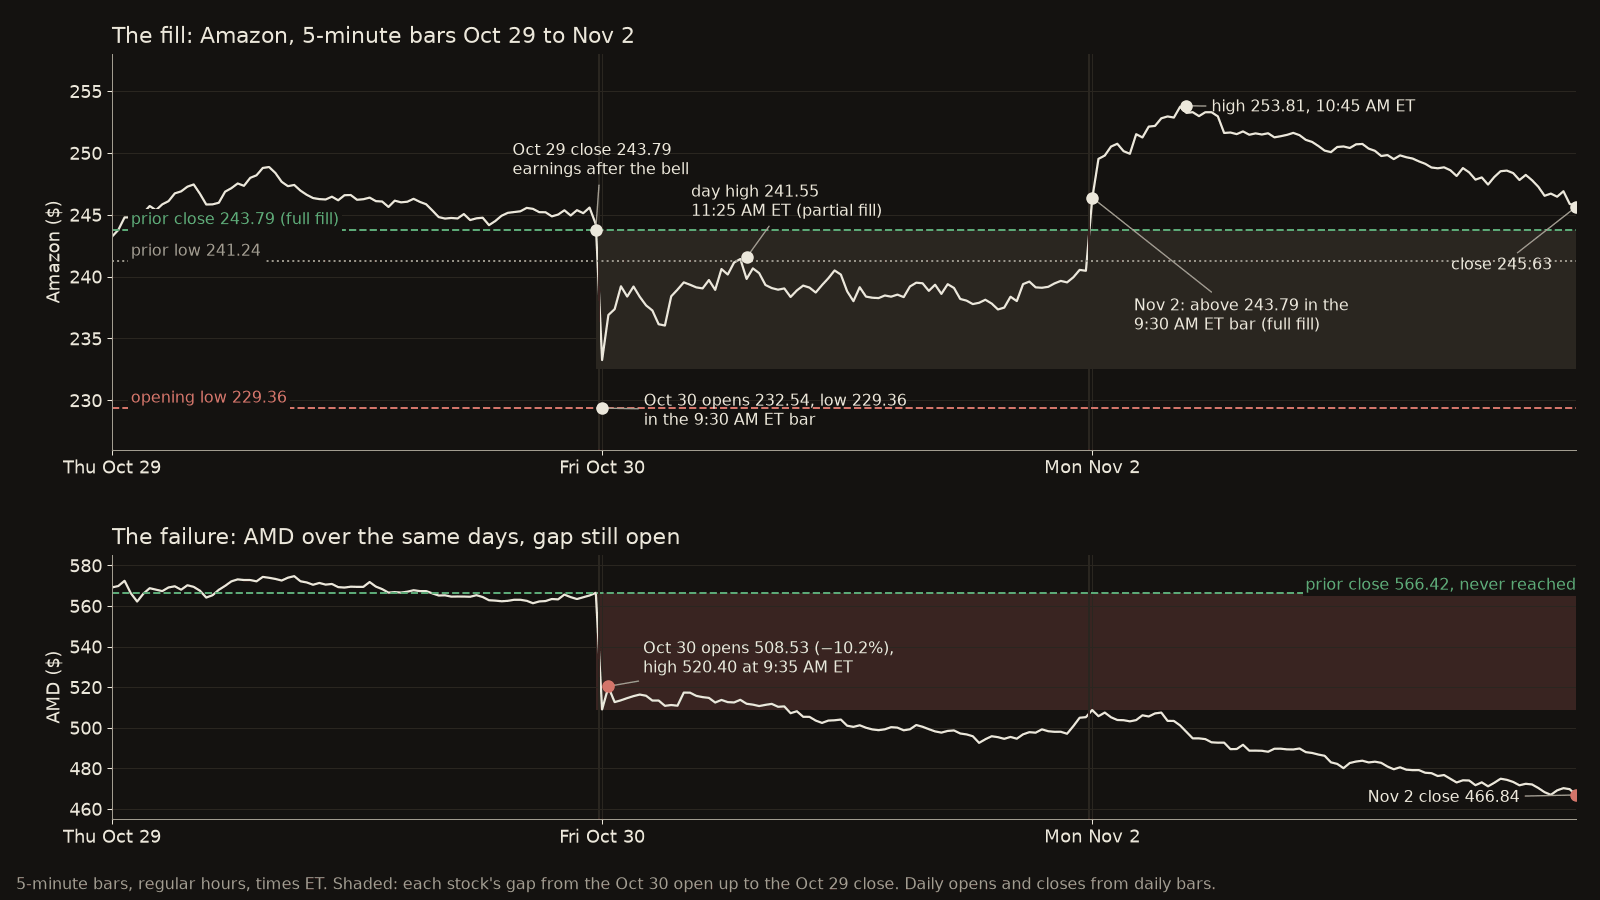
Amazon's report landed after Thursday's close. Posts say capital spending came in near $77 billion against estimates near $57 billion, and the calendar had options pricing a move of about 6.7%. Friday's open at $232.54 was about 4.6% lower, smaller than that priced move. The first 5-minute bar printed the low of the day, $229.36, and the selling never came back: by the end of the first half hour Amazon had reached $240.21, and in the 11:15 AM ET bar it touched the prior day's low of $241.24. The high of the day, $241.55 at 11:25 AM ET, closed about 80% of the $11.25 gap. It finished Friday at $240.35, about $3.44 short of a full fill.
Monday finished the job. Amazon opened at $243.01 and traded above $243.79 in the 9:30 AM ET bar, then ran to $253.81 by 10:45 AM ET before settling at $245.63, up about 2.2%. As a hypothetical, a trader who waited for the first half hour to settle and bought at $238.36 near 10:05 AM ET Friday, with a stop under the $229.36 opening low and the $243.79 close as the target, was risking about $9.00 a share to make about $5.43. The fill came, but the trade offered less reward than risk, because most of the gap had already filled before the setup was clear.
When it fails
AMD shows the other side. It closed at $566.42 on Oct 29 and opened Friday at $508.53, down about 10.2%, on a day Intel fell about 28.6% and the chip ETF about 7.0%. The bounce lasted five minutes: AMD reached $520.40 at 9:35 AM ET, recovering only about a fifth of the gap, then slid all day to close at $504.80. On Monday it opened at $510.71 and closed at $466.84, so the gap's top now sits about 17.6% above the price. Nothing about the chart said AMD would fill; what changed was the story around chipmakers, and the chart followed it.
That is the usual way a fill fails: the gap reflects real news that keeps getting worse, or a whole sector is being repriced, so every bounce meets sellers. What limits the damage is the invalidation line. A fill idea on AMD was wrong the moment it broke back below its opening low, at a small loss, rather than days later at a large one. In general terms, a stop beyond the opening extreme and a size small enough that hitting it is a shrug keep a failed fill from becoming a disaster.
Common mistakes
The first mistake is believing every gap must fill. Many do eventually, but eventually can mean weeks, and some never do. A gap is a level to watch, not a promise. The second is ignoring why the stock gapped. A gap on a broad overnight wobble behaves differently from one on a guidance cut or a sector-wide selloff, and the news is the first thing to read, before the chart.
The third is chasing. On Amazon, the first 30 minutes covered about two-thirds of the gap, so anyone who waited for certainty was left with a small target and a wide stop. Write down the risk and the reward before the trade, using the opening extreme and the prior close, and if the reward is smaller than the risk, the setup has already passed.
Try it on paper
Today gives you two live examples. Apple closed at $338.32 on Monday with a low of $335.82, and opened today at $325.54, about 3.8% lower; by 11:30 AM ET it had reached $334.50. Palantir closed at $178.34 with a low of $178.13, and opened at $167.93, about 5.8% lower; it had reached $176.31 by 11:00 AM ET. On each chart, draw the prior close, the prior low and today's opening low. Then write down, at today's close and again on Friday, whether each gap reached its partial fill, its full fill, or broke its opening low. Do this for every big gap you see for a month, and note the news behind each one. The pattern you'll want to see is which kinds of news produced fills and which produced AMD-style runs.
SOURCES ›
- Earnings afterhours 2026-10-29 (pulled Oct 30): AMZN EPS est 2.01, implied move about 6.7%; INTC EPS est 0.39, implied move about 6.9%
- Quotes, daily bars, regular hours: AMZN Oct 29 low 241.24, close 243.79; Oct 30 open 232.54, high 241.55, low 229.3632, close 240.35 (−1.41%); Nov 2 open 243.01, high 253.81, low 242.28, close 245.63 (+2.20%). AMD Oct 29 low 560.57, close 566.42; Oct 30 open 508.525, high 520.3956, close 504.80; Nov 2 open 510.705, close 466.84. INTC Oct 29 close 92.07, Oct 30 close 65.76 (−28.58%). SMH Oct 29 close 561.67, Oct 30 close 522.49 (−6.98%). AAPL Nov 2 low 335.82, close 338.32. PLTR Nov 2 low 178.13, close 178.34
- Quotes, 5-minute bars, regular hours, times ET: AMZN Oct 30 9:30 AM bar low 229.3632; first 30 minutes high 240.21; 10:00 AM bar close 238.36; 11:15 AM bar high 241.30; 11:25 AM bar high 241.55. AMZN Nov 2 9:30 AM bar high 246.39; 10:45 AM bar high 253.81. AMD Oct 30 9:35 AM bar high 520.3956
- Quotes, 5-minute bars, Nov 3, regular hours, times ET: AAPL open 325.54, high 334.50 (9:50 AM bar), last 331.57 at the 11:30 AM bar; PLTR open 167.93, high 176.31 (11:00 AM bar), last 172.22 at the 11:30 AM bar
- Derived: AMZN gap 243.79 − 232.54 = 11.25 (−4.61%); partial fill (241.55 − 232.54) / 11.25 = 80%; first 30 minutes (240.21 − 232.54) / 11.25 = 68%; hypothetical entry 238.36, risk 238.36 − 229.36 = 9.00, reward 243.79 − 238.36 = 5.43. AMD gap 566.42 − 508.53 = 57.89 (−10.22%); bounce (520.40 − 508.53) / 57.89 = 21%; Nov 2 close vs Oct 29 close −17.58%. AAPL open vs Nov 2 close −3.78%; PLTR −5.84%
- @wallstengine — “CapEx: $77.3B (Est. $57.47B)”
- @FirstSquawk — “AMAZON SLUMPED AFTER HOURS ON HIGHER AI SPENDING, AND INTEL FELL ON A WEAKER REVENUE OUTLOOK.”
Get tomorrow's brief before the open.
One feature a day, every day. Free. Unsubscribe anytime. Privacy