- A stop is the price where a trade idea is proven wrong, and a stop order turns into a market order once that price trades, so it is a trigger, not a guaranteed exit price.
- A hypothetical Nvidia long from the Nov 6 close of $186.64 with a stop at $185.00 planned to risk $1.64 a share; Monday's open at $173.07 made the real loss $13.57 a share, about 8 times the plan.
- Stops work best placed where the chart says you are wrong and outside a day's normal noise, and fail on gaps; the classic mistake is treating the stop's distance as the most you can lose.
Key numbers
Stop placement
- Start from the chart, not a round percentage: put the stop just past the price that would prove the idea wrong, such as a recent swing low for a long.
- Check that distance against the stock's average true range (ATR), the average size of one day's move including gaps; a stop inside a small fraction of one ATR is likely to be hit by ordinary noise.
- Pick the order type: a stop order becomes a market order when touched and fills at the next available price, while a stop-limit order caps the fill price but may not fill at all.
- Work out the dollar risk as shares times the distance to the stop, and remember an overnight gap can make the real loss larger than that.
Get the Desk's features and the market mood in your inbox. Free.
One feature a day, every day. Free. Unsubscribe anytime.
Nvidia closed Friday, Nov 6, at $186.64 and opened Monday at $173.07, about 7.3% lower, after its board said it would look into reports about its chief executive. Nothing traded in between during regular hours. For anyone holding a stop just under Friday's low, that weekend is the whole lesson: a stop decides when you get out, not the price you get.
What it is
A stop is the price at which a trade idea is proven wrong, written down before the trade starts. It turns a vague worry into a number, and it caps how long a losing idea can run. A stop order is the tool that enforces it: once the stock trades at or through the stop price, the order becomes a market order and sells at the next price available. That last detail is the one most people skip.
How it works
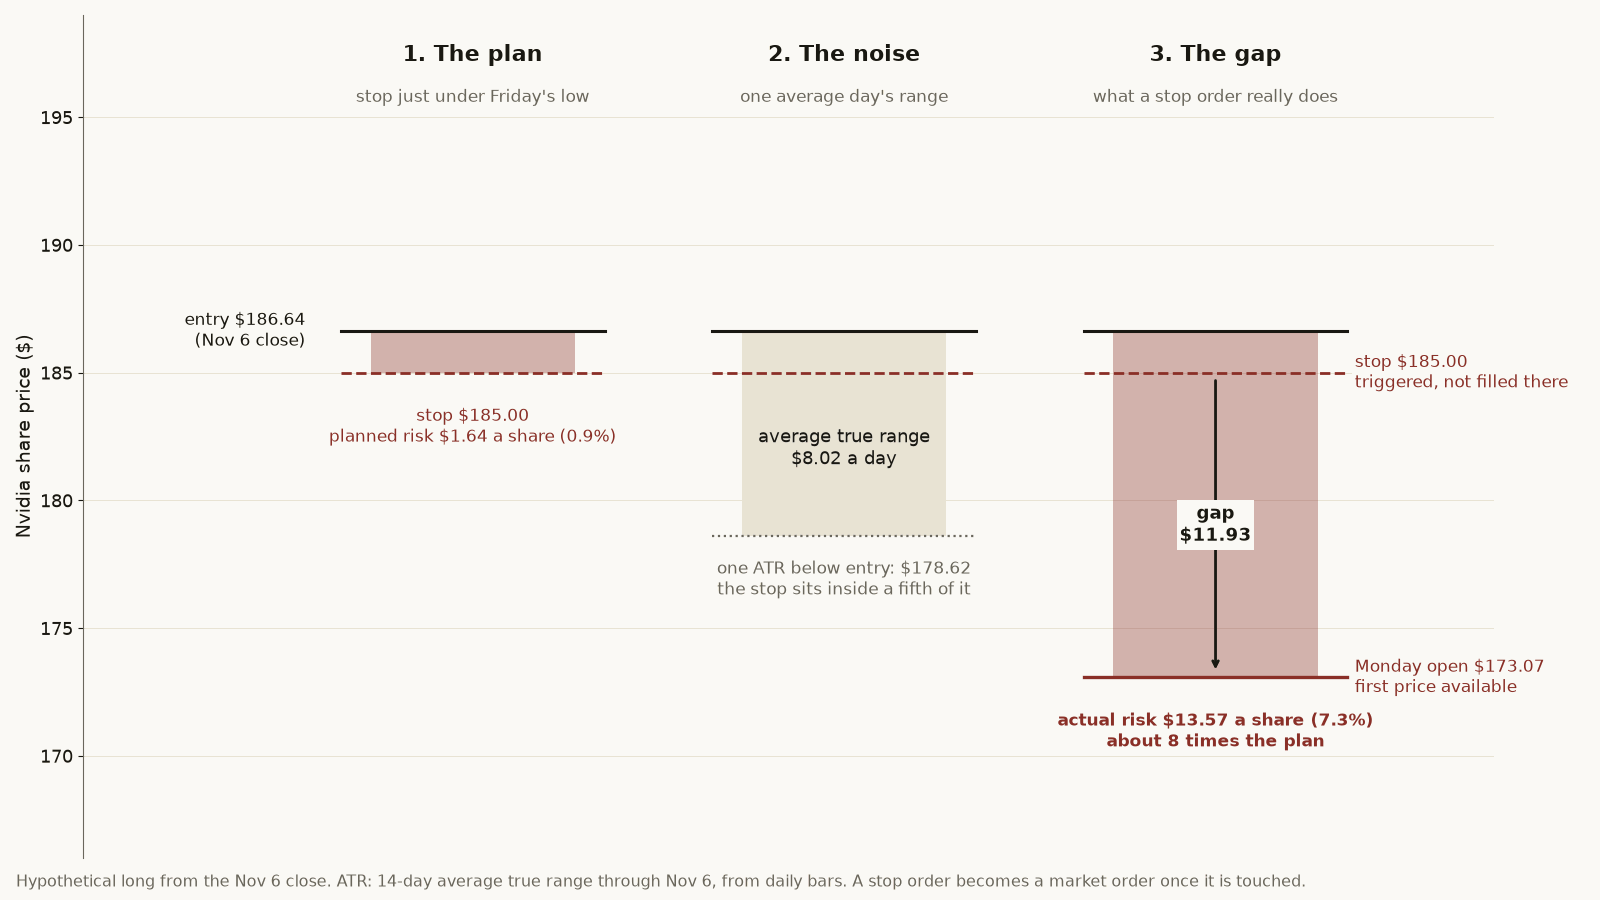
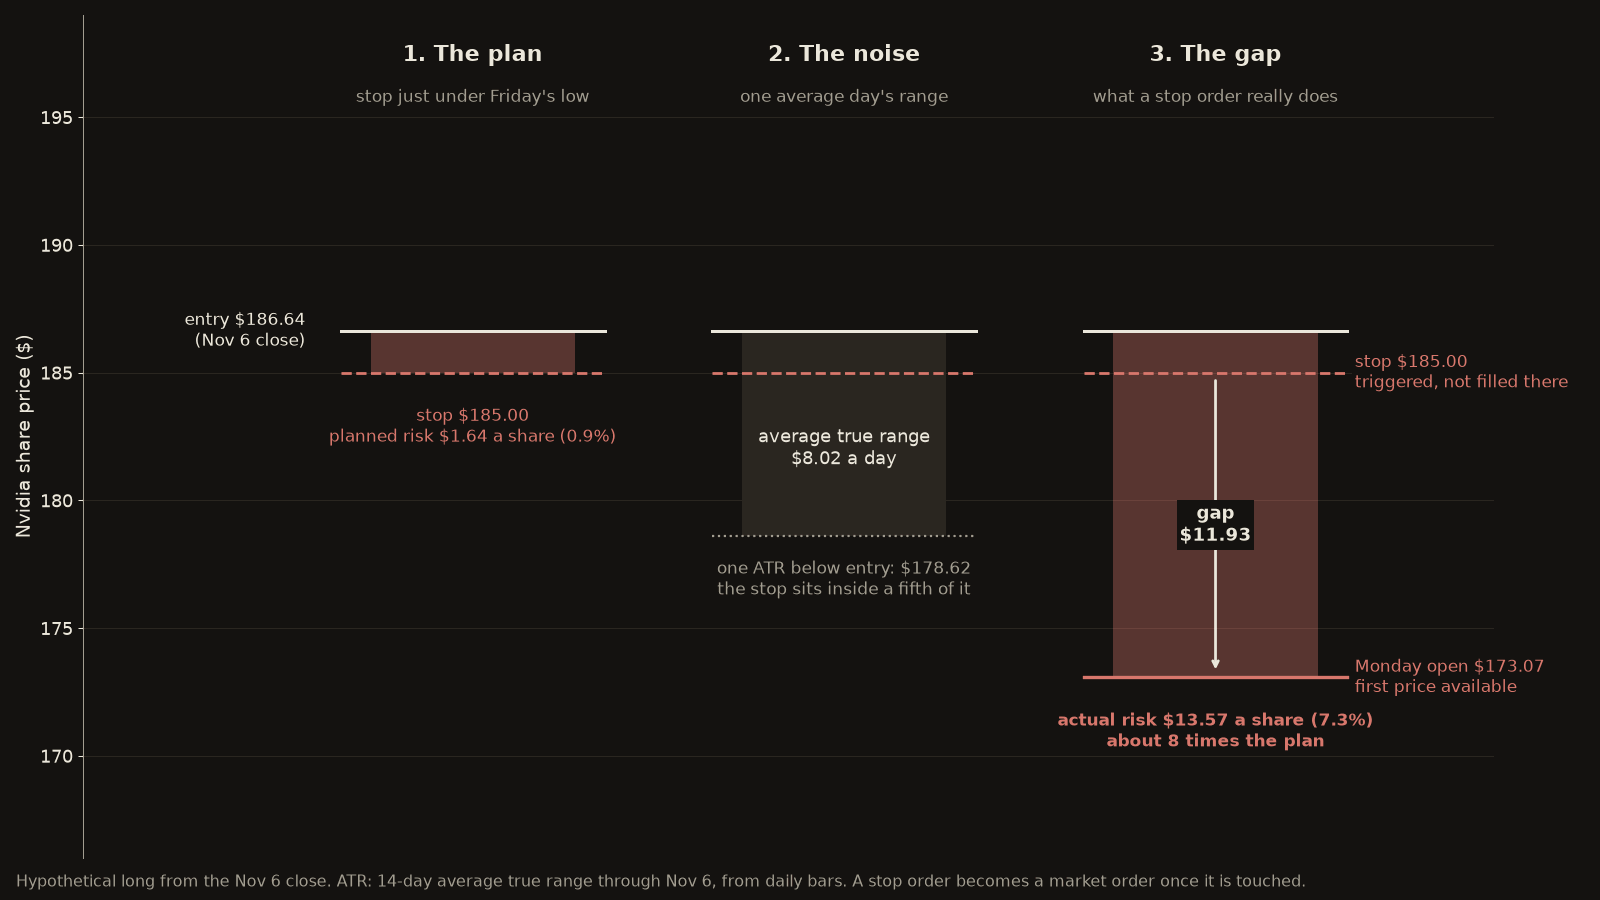
Placing a stop takes three checks. First, the chart: for a long, the natural spot is just under a level buyers defended, such as a recent low. Nvidia's Friday low was $185.22 at 12:50 PM ET, so a hypothetical stop at $185.00 sat just under it, $1.64 below the $186.64 close. Second, the noise: Nvidia's 14-day average true range through Friday was $8.02, about 4.3% of its price, which means a $1.64 stop sat inside about a fifth of one ordinary day. A stop that tight is betting the stock barely moves at all. Third, the order type: a stop order guarantees an exit once triggered but not the price; a stop-limit order, say a $185.00 stop with a $184.50 limit, guarantees the price but not the exit.
On this week's tape
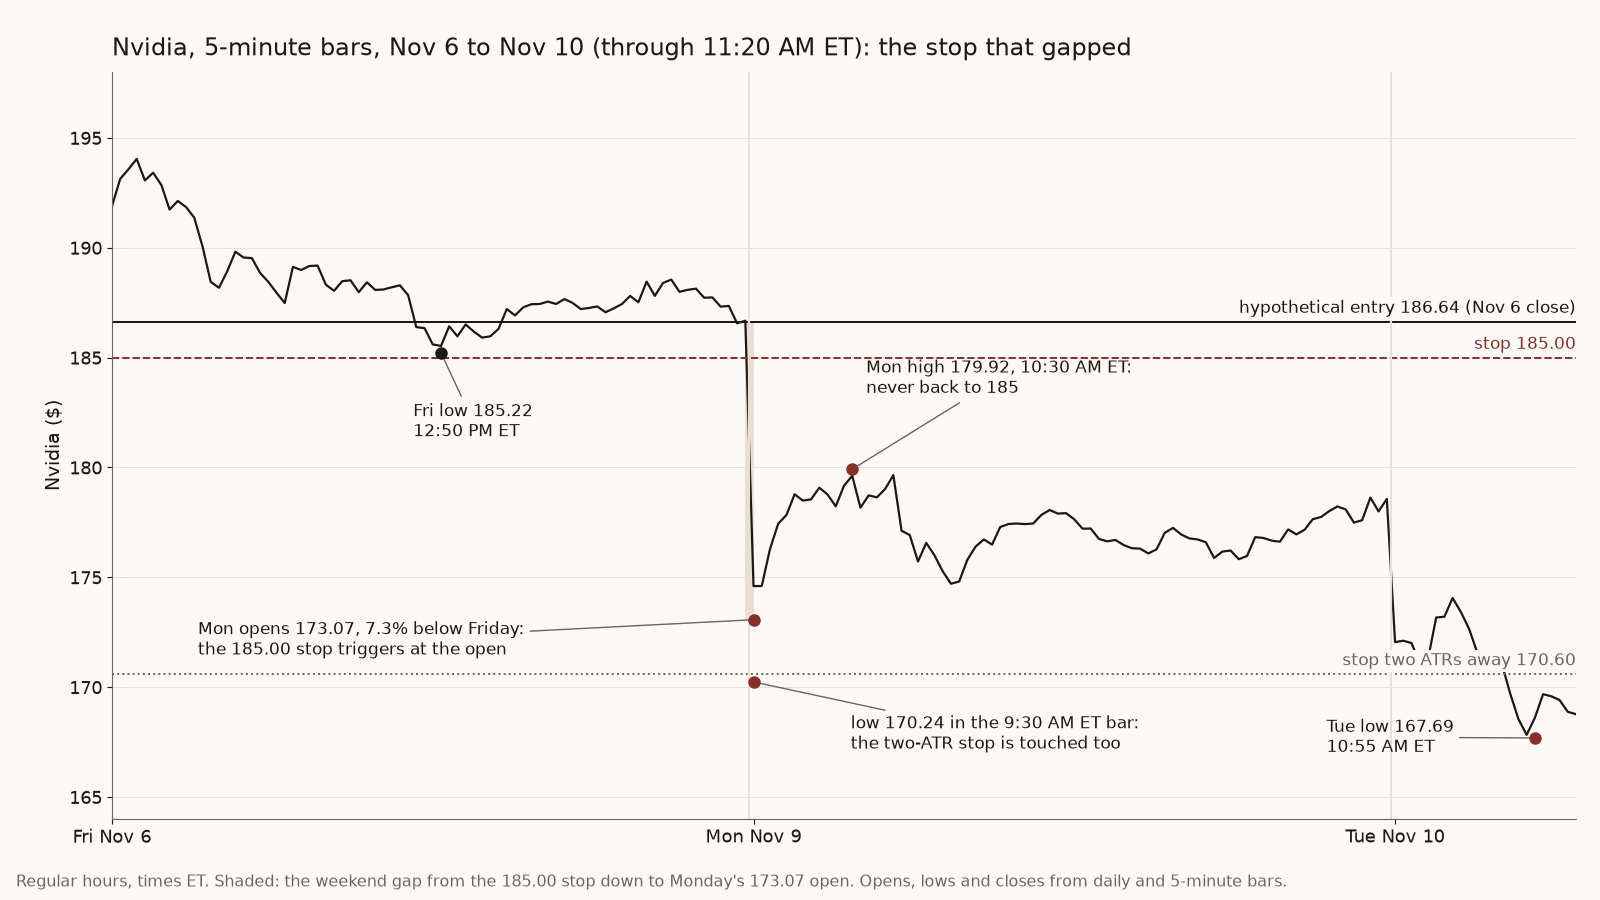
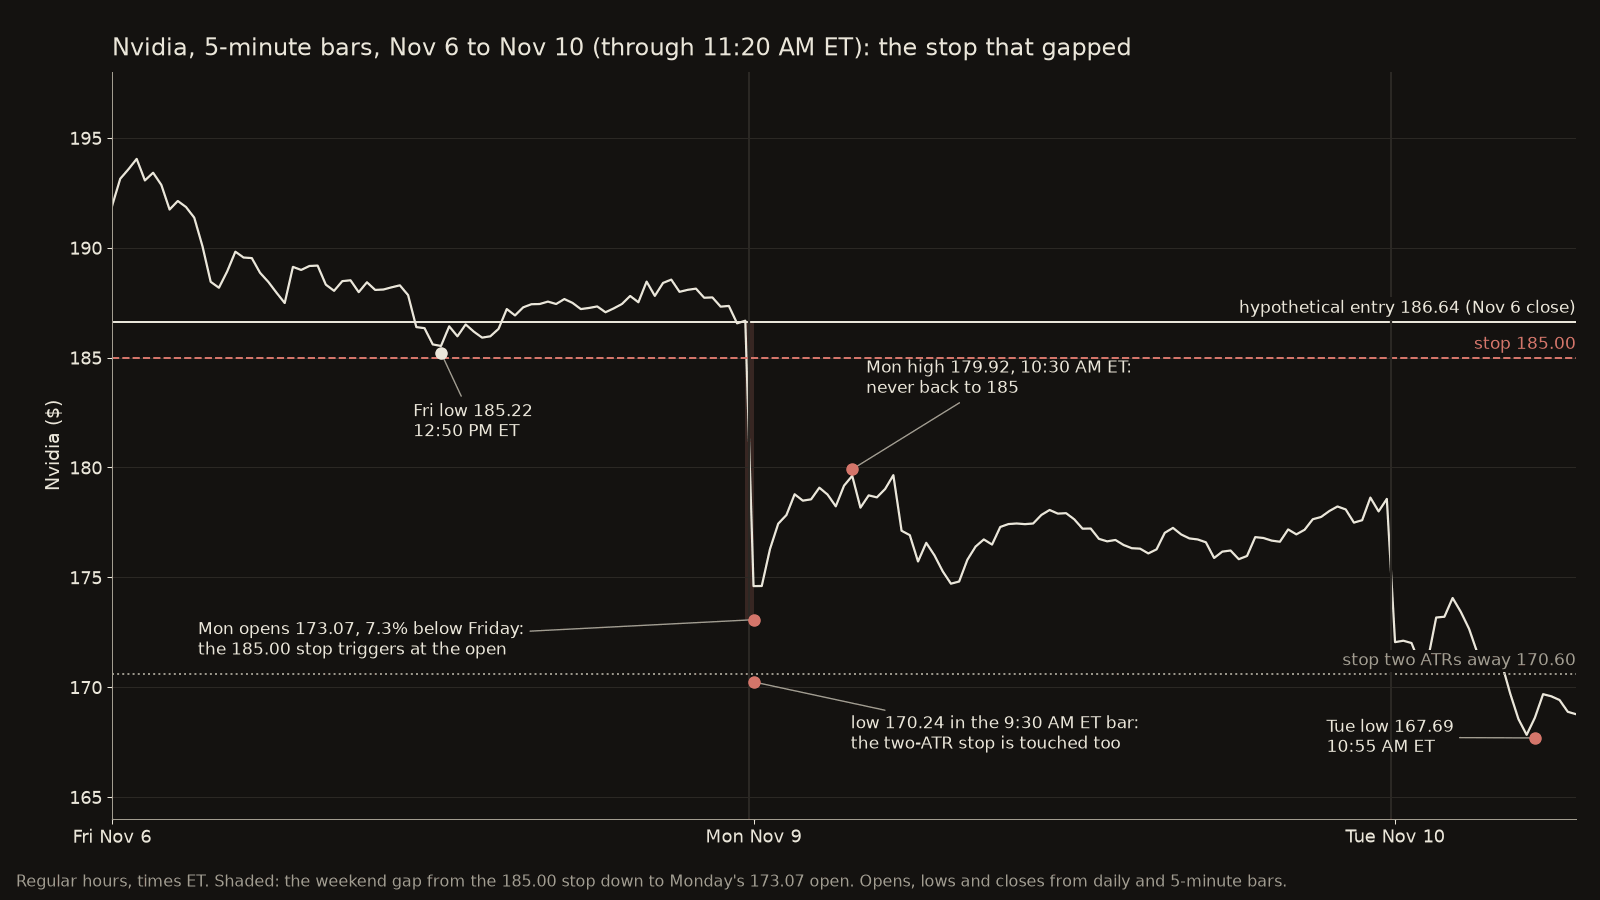
Take the hypothetical long from Friday's $186.64 close with the $185.00 stop. Monday's first trade came at $173.07, so the stop triggered at the open and a market sale would have filled around there: $11.93 below the stop and $13.57 a share below entry, about 8 times the $1.64 the plan allowed. A wider stop two ATRs away, at $170.60, would not have escaped either, because Monday's low in the first 5-minute bar was $170.24. The stop-limit version shows the other trade-off. Monday's high was $179.92 at 10:30 AM ET and the stock closed at $178.67, so a $184.50 limit never filled; by Tuesday's low of $167.69 at 10:55 AM ET, that position was down about 10.2% from entry.
When it fails
Stops fail on gaps: earnings after the close, a weekend headline, a ruling or a data release before the open. Nvidia's weekend is the plain example, and both order types failed in their own way, one filling far below the stop and the other not filling at all. What limits the damage is size, not the stop: if the position was sized so that a gap several times the planned distance would still be survivable, the stop did its job of ending the trade even when it could not protect the price.
Common mistakes
The first mistake is treating the distance to the stop as the maximum loss, when it is only the expected loss in a market that trades continuously. The second is setting stops at round percentages, like 1% or 2%, without checking the stock's ATR; a stop well inside one day's normal range mostly measures noise. The third is moving a stop further away once price gets close, which turns a written plan back into a hope.
Try it on paper
Pick three stocks you follow and, for each, write down a recent swing low, the 14-day ATR and where a stop just under that low would sit as a fraction of one ATR. Then note which of the three report earnings or have big news due before the next open. Over a few weeks, log every paper stop that triggers and compare the planned price with the price you would actually have gotten. The gap between those two numbers is the risk the stop does not cover.
SOURCES ›
- Economic calendar 2026-11-10: CPI (Oct) 8:30 AM ET; next release weekly jobless claims Thu Nov 12 8:30 AM ET (from data/market/hero.json and the morning brief)
- NVDA daily bars (regular hours) Sep 15 to Nov 9, 2026: Nov 6 open 191.10, high 194.895, low 185.22, close 186.64; Nov 9 open 173.065, high 179.92, low 170.24, close 178.67
- 14-day average true range through Nov 6 computed from those daily bars: 8.02 (through Nov 9: 8.78)
- NVDA 5-minute bars (regular hours, ET) Nov 6 9:30 AM to Nov 10 11:20 AM: Nov 6 low 185.22 in the 12:50 PM bar; Nov 9 low 170.24 in the 9:30 AM bar, high 179.92 in the 10:30 AM bar; Nov 10 low 167.69 in the 10:55 AM bar; 11:20 AM bar close 168.77
- Derived: planned risk 186.64 − 185.00 = 1.64 (0.88%); gap 185.00 − 173.07 = 11.93; actual risk 186.64 − 173.07 = 13.57 (7.27%), 8.3 times plan; two-ATR stop 186.64 − 16.04 = 170.60; Tue low vs entry −10.15%
- Mood Choppy from data/market/hero.json, 9:56 AM ET Nov 10
- @FT — “Nvidia shares dropped in pre-market trading on Monday after the chipmaker’s board said it would open an investigation into reports that chief executive Jensen Huang was the target of a foreign espionage operation.”
- @Reuters — “Nvidia shares fell sharply after an internal investigation into whether CEO Jensen Huang had been targeted by a foreign intelligence effort put his future at the AI chipmaker under scrutiny”
Get tomorrow's feature in your inbox.
One feature a day, every day. Free. Unsubscribe anytime. Privacy