- The S&P 500 closed at 7,376.86, down 2.68% on the week, just above Thursday's 7,350 low and its 200-day average at 7,325, with the broken Oct 30 low at 7,528 overhead.
- The Nasdaq 100 lagged with a 4.91% weekly drop to 26,989.99, below its 200-day average at 27,984 and parked on the 27,000 round number.
- AppLovin's 71.21% weekly jump and AMD's 11.05% slide put both on the board; the pivot that matters most is the S&P's 7,350, Thursday's low, with CPI due Tuesday at 8:30 AM ET.
Key numbers
Levels to watch
- 7,715.57RESISTANCENov 4 post-election high, just above the 50-day average at 7,679 and the 20-day at 7,658
- 7,527.56RESISTANCEOct 30 low, the floor that gave way Thursday, with heavy open interest at the 7,500 strike
- 7,350.35PIVOTThursday's low; Friday held above it and closed about 27 points over it
- 7,325.05SUPPORT200-day average
- 7,200SUPPORTRound number with heavy put open interest
- 28,713.45RESISTANCEBottom of the Oct 30 gap, still open up to 29,257
- 27,983.89RESISTANCE200-day average, lost Thursday, with Thursday's open gap from 28,078 to 28,276 just above
- 27,000PIVOTRound number with the heaviest put open interest near price; Friday closed 10 points under it
- 26,606.43SUPPORTThursday's low
- 416.09RESISTANCETop of the Aug 6 gap, with the 200-day average at 409 just under it
- 400.00RESISTANCERound number with the most call open interest; Friday's high was 398
- 352.00PIVOTBottom of the Aug 6 gap; Friday's low at 348.69 dipped under it and recovered
- 338.88SUPPORTTop of this week's post-earnings gap, open down to 275.48
- 275.48SUPPORTBottom of the post-earnings gap
- 500.00RESISTANCERound number with heavy call and put open interest, under the Oct 30 gap from 520.40 to 560.57
- 476.50RESISTANCETop of Thursday's gap, open down to 456.20
- 450.00PIVOTRound number with heavy put open interest; Friday closed 96 cents under it
- 415.98SUPPORT200-day average, which Thursday's close broke and Friday won back
- 402.10SUPPORTThursday's low, on top of the May gap that ends at 402.04 and the 400 strike, the heaviest put open interest
Get the Desk's features and the market mood in your inbox. Free.
One feature a day, every day. Free. Unsubscribe anytime.
The charts broke on Thursday. The S&P 500 fell 4.36% that day and finished the week down 2.68% at 7,376.86, holding just above Thursday's low and its 200-day average. The Nasdaq 100 fell 6.36% on Thursday and 4.91% for the week to 26,989.99, and unlike the S&P it closed below its 200-day average on both Thursday and Friday, the first closes under it since at least April.
The S&P 500
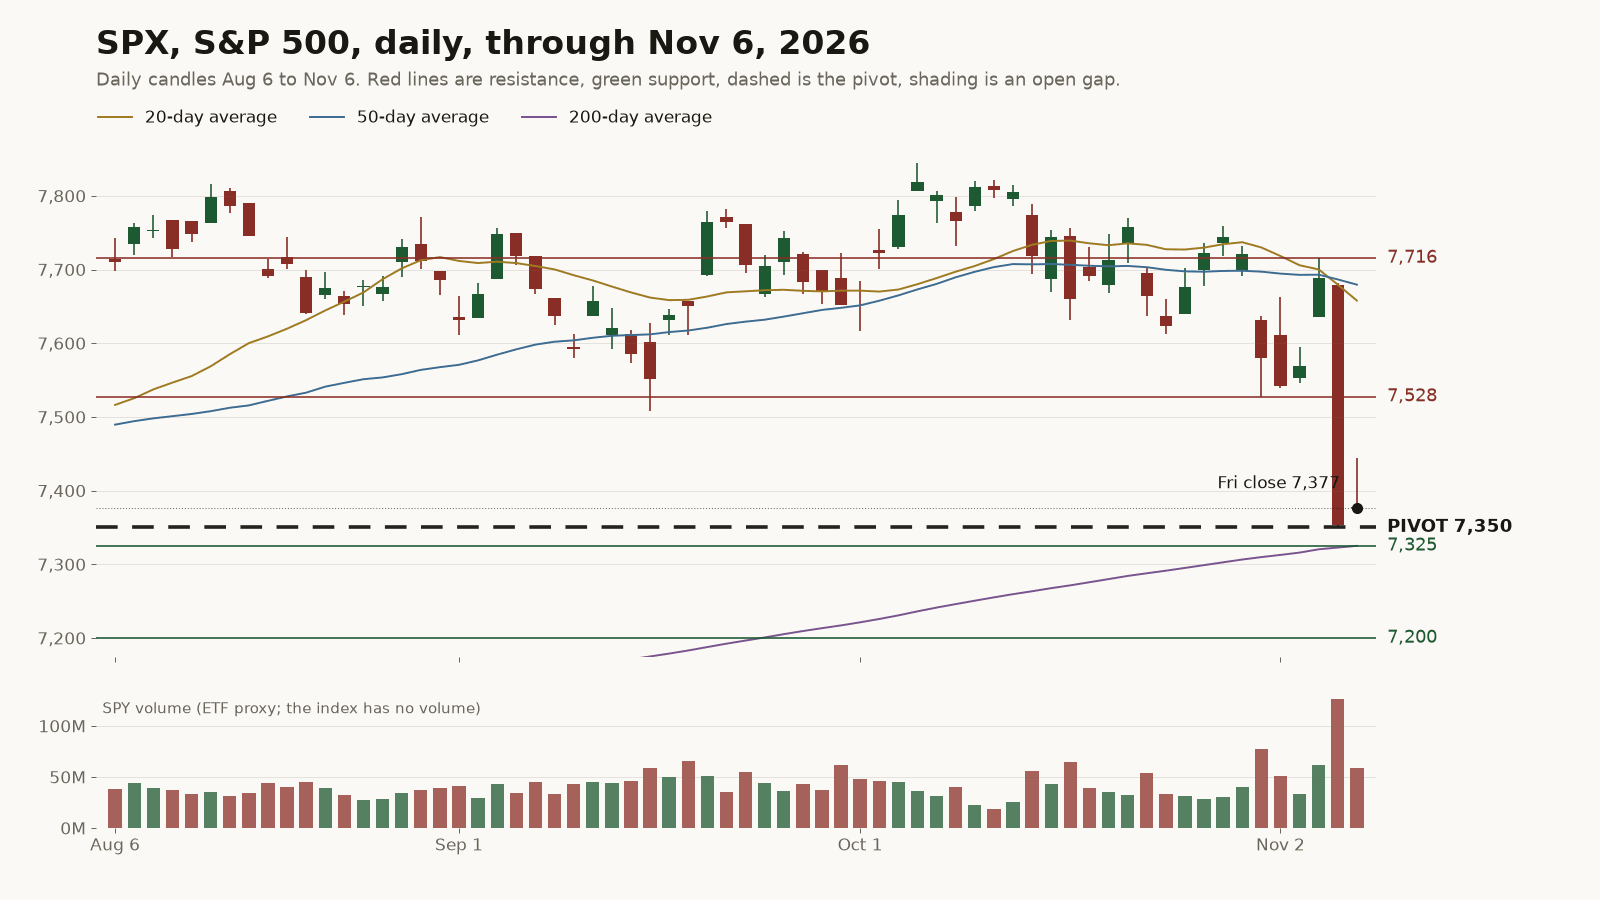
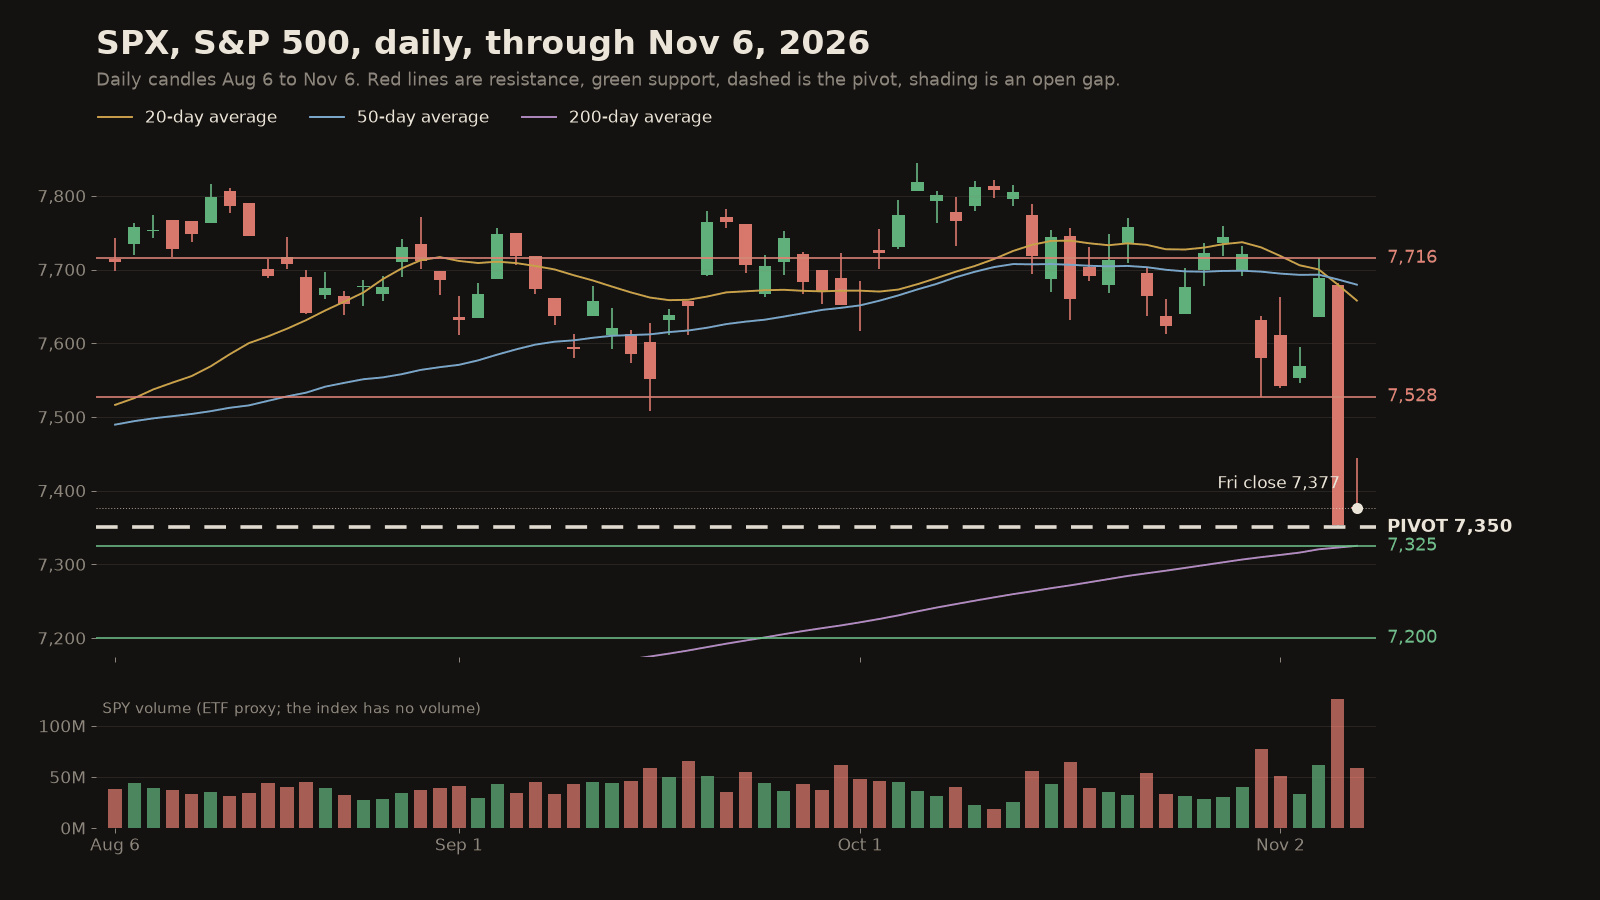
Thursday's drop took the index through the Oct 30 low at 7,527.56, the floor the last two weeks had rested on, and Friday's small bounce stayed inside Thursday's range with a high of 7,444.20. Price is now about 6.0% below the Oct 6 high at 7,844.52 and under both the 20-day average at 7,658 and the 50-day at 7,679, and the 20-day has started to roll over. The pivot is 7,350.35, Thursday's low, with the 200-day at 7,325.05 just under it. Above, 7,528 is the first broken floor to win back, and Wednesday's post-election high at 7,715.57 caps the shorter averages. Below the 200-day, 7,200 is the next round number with heavy put open interest.
The Nasdaq 100
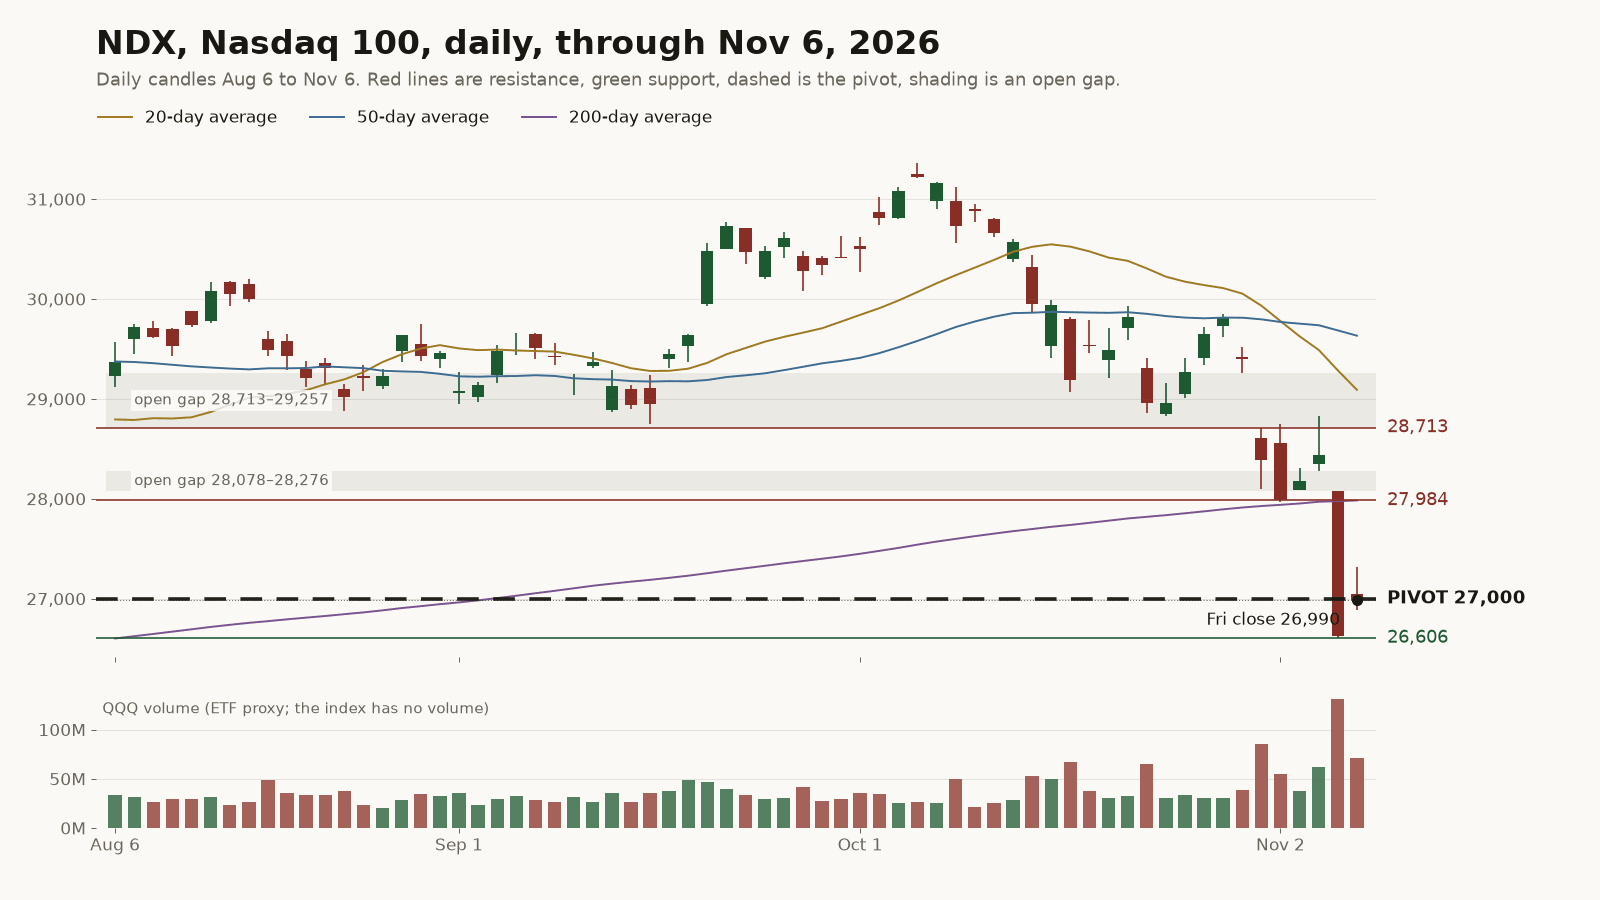
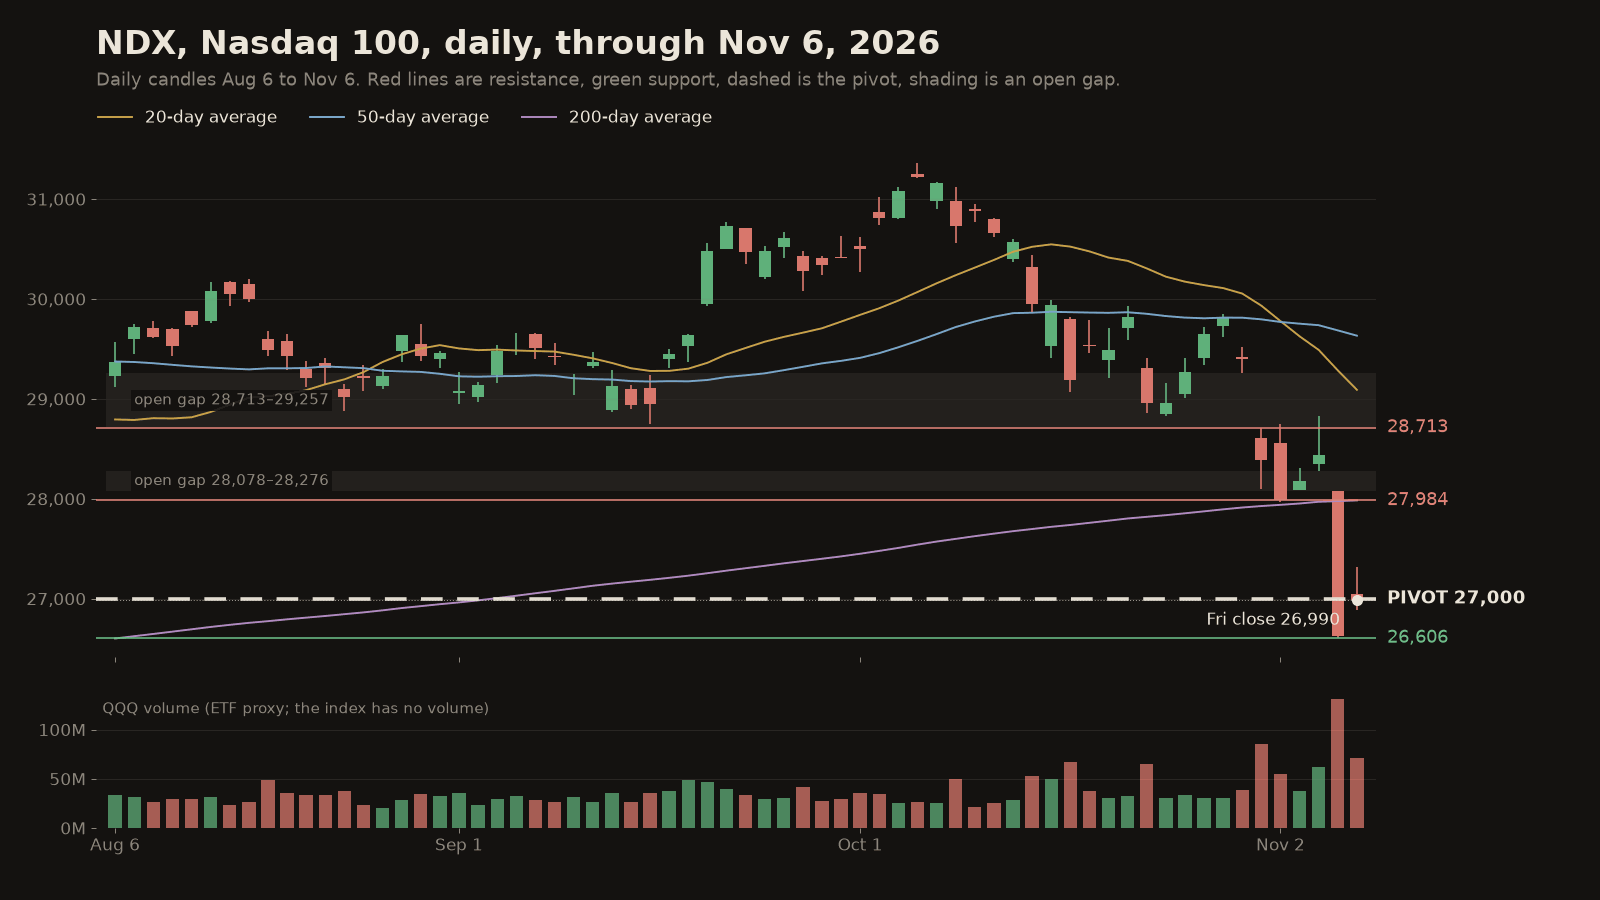
Tech did the damage. The Nasdaq 100 lost 4.91% on the week against 2.68% for the S&P and is about 13.9% below its Oct 6 high at 31,361. Thursday's open left a gap from 28,078 to 28,276 that Friday never reached, just above the 200-day average at 27,984, and the Oct 30 gap from 28,713 to 29,257 is still open above that. The pivot is 27,000, a round number with the heaviest put open interest near the price, and Friday closed 10 points under it. Thursday's low at 26,606.43 is the only level with history below.
AppLovin after its earnings gap
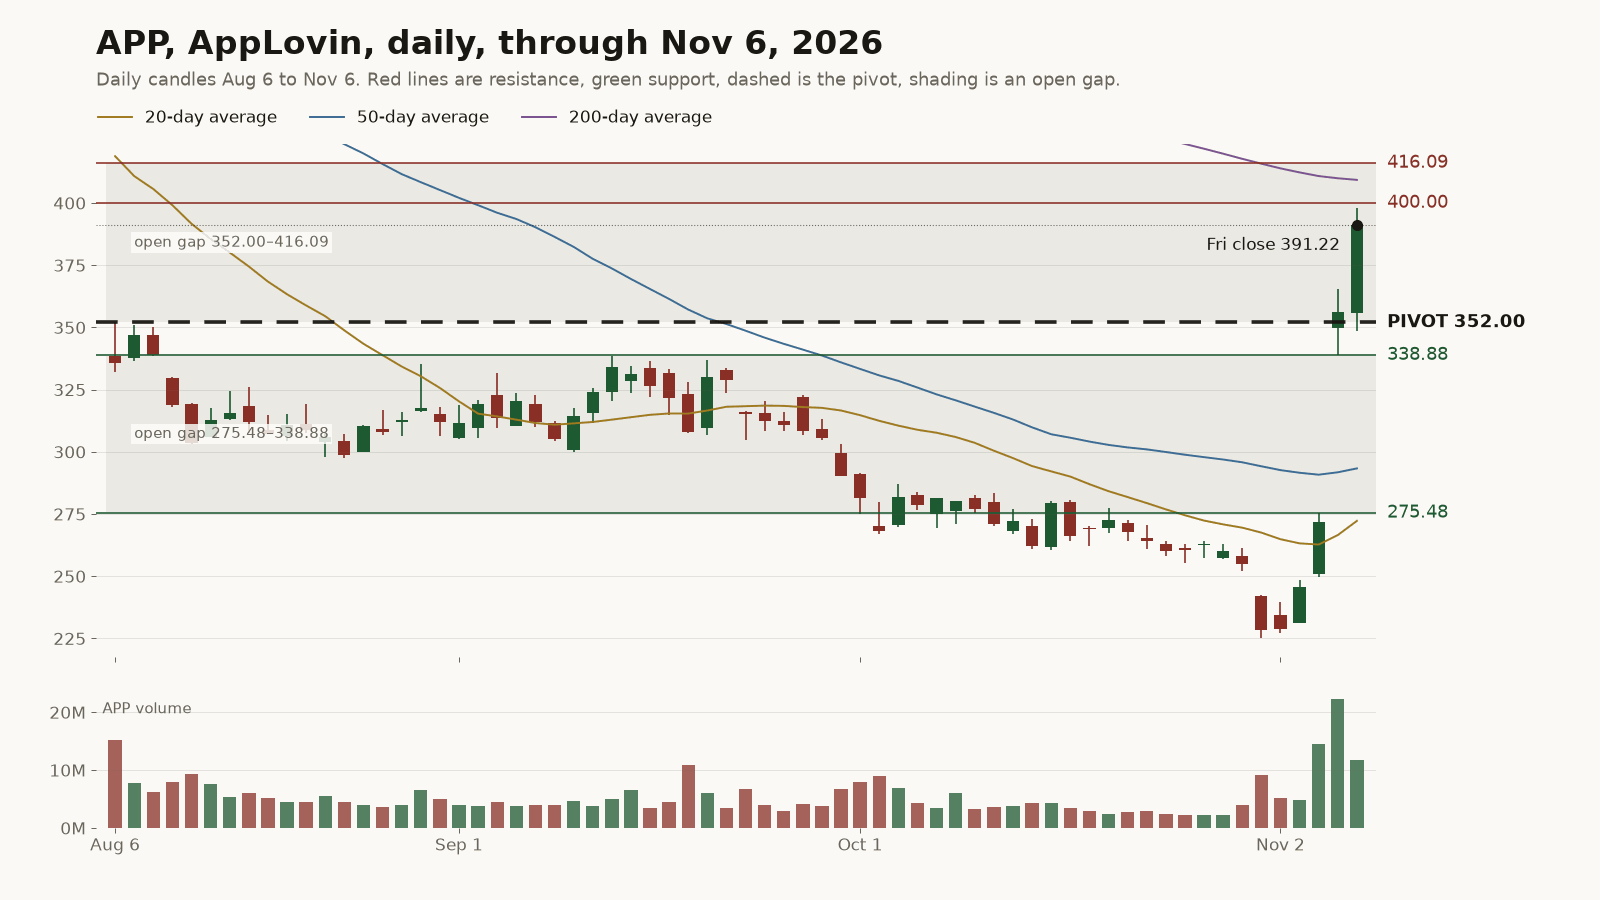
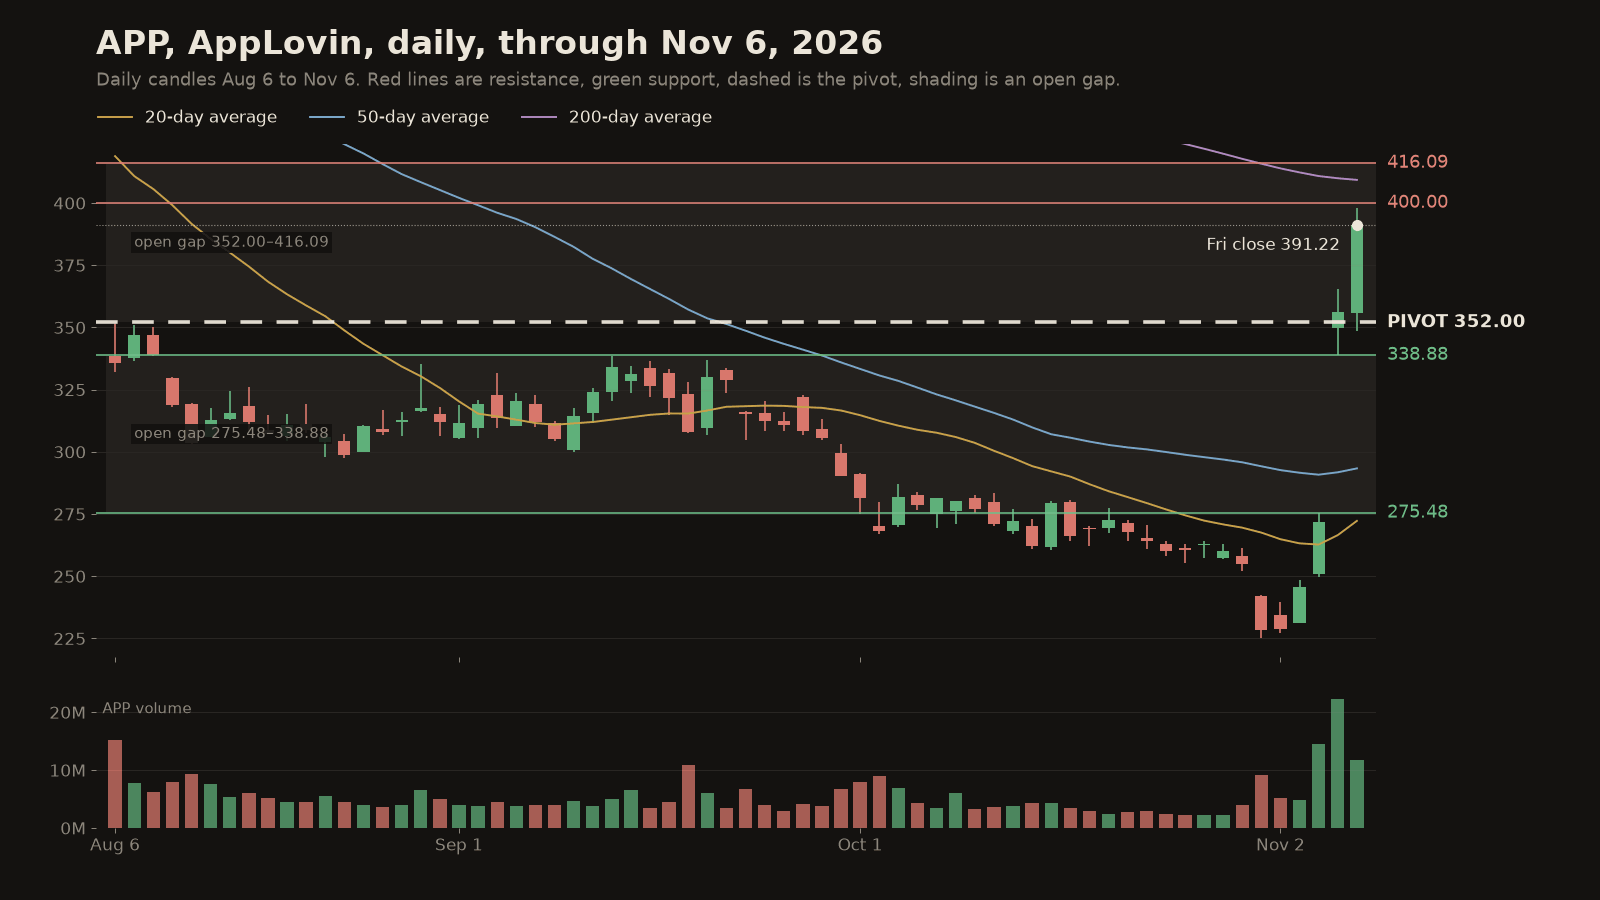
AppLovin made the board with a 71.21% weekly gain after it beat third-quarter estimates on Wednesday and guided fourth-quarter revenue to $2.37 billion to $2.40 billion, above the roughly $2.25 billion the street expected. The stock rose 31.04% on Thursday and 9.86% on Friday to 391.22. Thursday's open left a gap from 275.48 to 338.88 below, and the rally ran straight into the gap the stock left on Aug 6, from 352.00 to 416.09. The pivot is 352.00, the bottom of that August gap, which Friday's low at 348.69 dipped under before the close recovered. Above, 400 has the most call open interest and Friday's high stopped at 398, and the top of the August gap at 416.09 sits just over the 200-day average at 409.
AMD after the chip washout
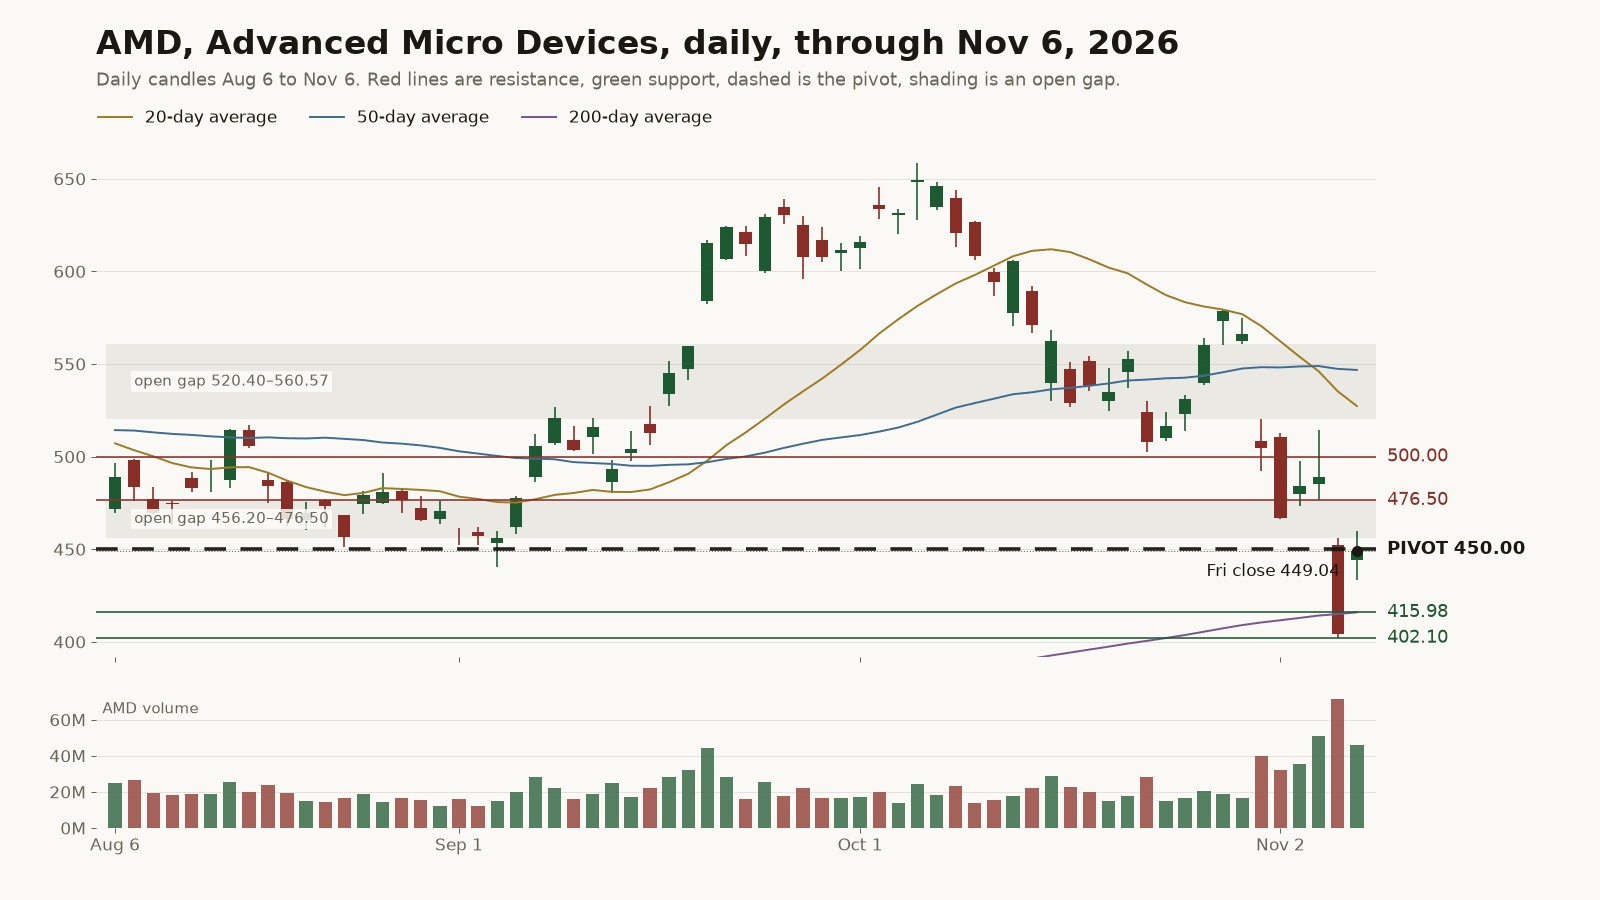
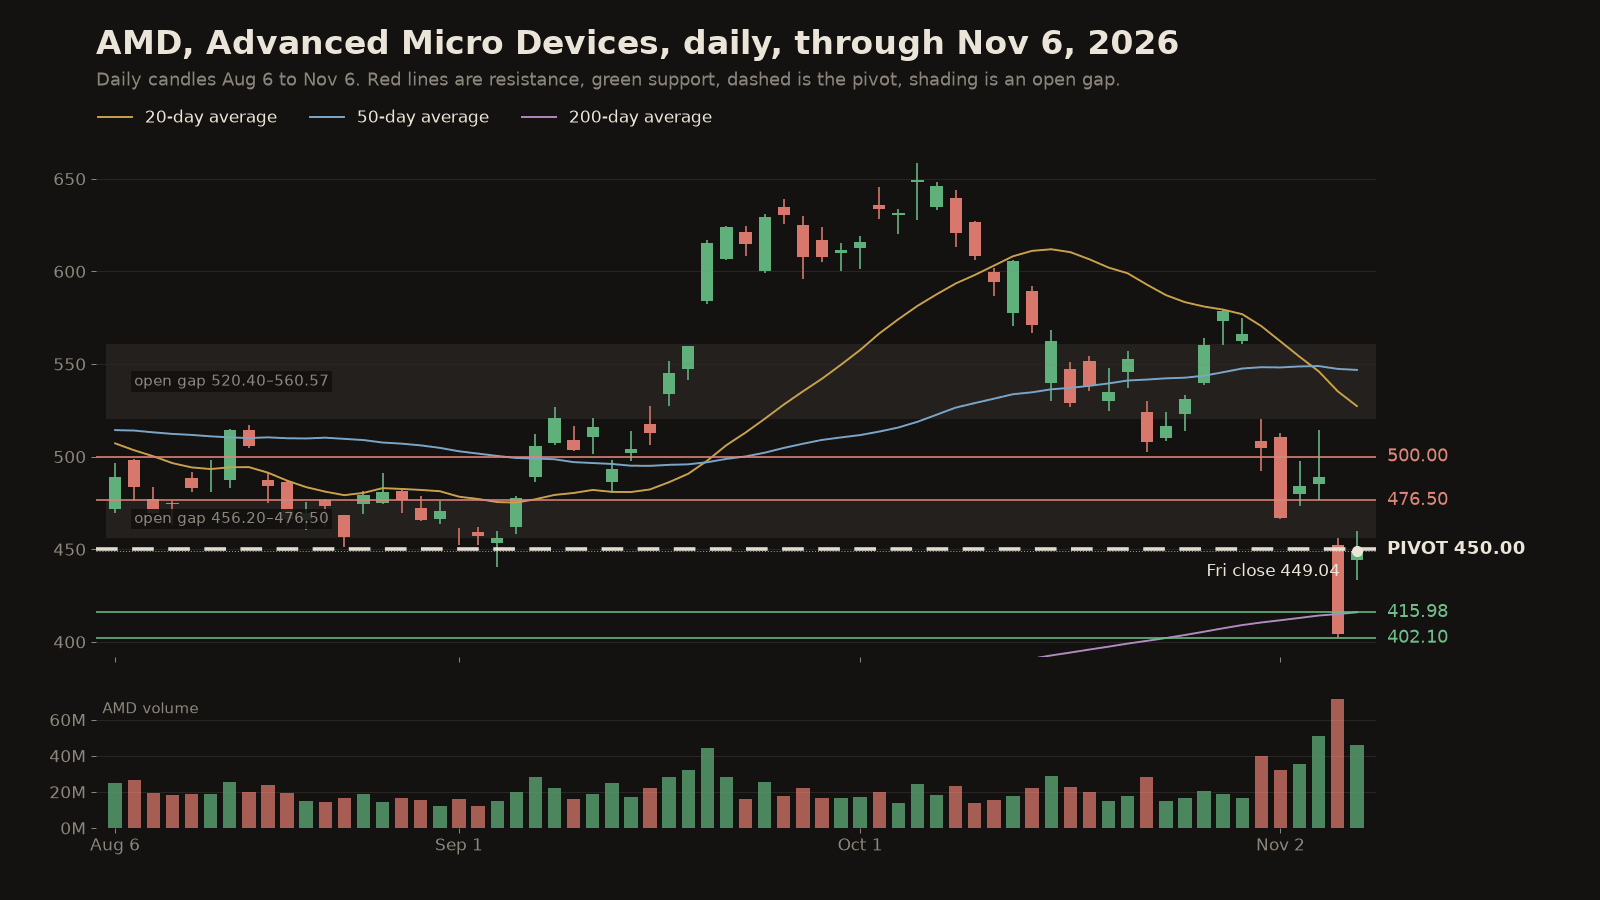
AMD made the board as the sharpest swing in Thursday's chip selloff, which posts tied to fears of tighter AI rules after the Democratic sweep. It fell 17.26% on Thursday to close under its 200-day average, then rose 11.04% on Friday to 449.04, ending the week down 11.05% and about 31.8% below its Oct 6 high. Two gaps sit overhead: Thursday's, from 456.20 to 476.50, and Oct 30's, from 520.40 to 560.57, with 500 between them. The pivot is 450, a round number with heavy put open interest, 96 cents above Friday's close. Below, the 200-day at 415.98 and Thursday's 402.10 low, right on top of the May gap and the 400 strike with the heaviest put open interest, are the levels with history.
Pivot moments next week
Monday's first test is Chicago Fed President Austan Goolsbee at 10:00 AM ET, after Friday's hot payrolls put rate hikes back in the conversation. The big one is October CPI on Tuesday at 8:30 AM ET (prior core +0.3% month over month), which tests the S&P's 7,350 pivot and the Nasdaq 100's 27,000. CoreWeave reports after Tuesday's close with an implied move of about 18.1%, an AI infrastructure read for AMD's 450. Thursday has jobless claims at 8:30 AM ET, then Cisco and Applied Materials after the close (implied moves about 8.2% and 9.3%), the week's main chip read for AMD and the Nasdaq's 200-day near 27,984. Friday's October producer prices at 8:30 AM ET (prior core +0.7%) close the week. AppLovin has no scheduled report, so its gap levels trade on the broader tape.
How to read these levels
These levels mark where the market has reacted before and may again. They are not predictions or trade signals. A daily close through a level says more than an intraday poke, and an open gap tends to stay a reference point until price trades back through it.
- HeatingThe AI spending boomThe Nasdaq 100 closed under its 200-day average for the first time since at least April as AMD fell 17.26% on Thursday, and Friday's 11.04% AMD bounce left it right on its 450 pivot.
- CoolingCan the average stock catch up?The S&P 500 held its 200-day while the Nasdaq 100 lost its own, a 2.2-point weekly gap between the two.
SOURCES ›
- Economic calendar, pulled 10:04 AM ET 2026-11-07: Mon 11/9 10:00 AM ET Chicago Fed President Austan Goolsbee speaks; Tue 11/10 8:30 AM ET October CPI (prior headline +0.6% m/m, core +0.3% m/m, headline 3.7% y/y, core 2.6% y/y); Thu 11/12 8:30 AM ET weekly jobless claims; Fri 11/13 8:30 AM ET October PPI (prior +1.3% m/m, ex-food and energy +0.7% m/m). No forecasts posted.
- Earnings calendar, pulled 10:04 AM ET 2026-11-07: Tue 11/10 after the close CoreWeave (CRWV, expected move 18.10%); Thu 11/12 after the close Cisco (CSCO, expected move 8.18%) and Applied Materials (AMAT, expected move 9.31%).
- Index daily bars from quotes for SPX and NDX, Jul 1, 2025 to Nov 6, 2026 close (4:00 PM ET); 20, 50 and 200-day averages computed from those closes. SPX 7,376.86 vs 7,580.07 Oct 30 (−2.68%); NDX 26,989.99 vs 28,384.85 (−4.91%). Gaps, highs and lows from the same bars.
- Equity daily bars from quotes for SPY, QQQ (volume panels), APP and AMD, Jul 1, 2025 to Nov 6, 2026 close (4:00 PM ET). APP 391.22 vs 228.50 Oct 30 (+71.21%), Thu +31.04%, Fri +9.86%; AMD 449.04 vs 504.80 (−11.05%), Thu −17.26%, Fri +11.04%.
- Options open interest by strike, as of the Nov 6 close, pulled 10:04 AM ET 2026-11-07: SPX 7,500 (113,225 calls, 184,116 puts), 7,200 (116,588 puts); NDX 27,000 (4,704 puts, the most near price); APP 400 (15,356 calls, the most), 350 (4,688 puts); AMD 500 (47,085 calls, 44,619 puts), 450 (48,498 puts), 400 (77,342 puts, the most).
- Charts: drawn from the same daily bars and open interest, Aug 6 to Nov 6, 2026.
- @wallstengine — “Revenue: $2.37B-$2.40B (Est. $2.25B)”
- @WOLF_Financial — “EPS: $4.30, beating expectations of $4.04”
- @Schuldensuehner — “Blue-Nami hits the AI trade: Nasdaq 100 sinks ~5% amid fears of tighter AI regulation after Democrats sweep Congress.”
- @WOLF_Financial — “THE NASDAQ 100 IS NOW DOWN -6.1% TODAY AS THE SELLOFF IN CHIP STOCKS DEEPENS”
- @DeItaone — “US JOBS SURGE. FED HIKE ODDS REBOUND.”
Get tomorrow's feature in your inbox.
One feature a day, every day. Free. Unsubscribe anytime. Privacy